Download
1 / 18
190 likes | 728 Vues
Cancer. Tumor - abnormal growth of tissue Benign tumors - self-contained, non-cancerous Malignant tumors - tumors made of cells that continuously divide; cancerous. Characteristics of Malignant Cells. Divide continually (given space and nutrients)

E N D
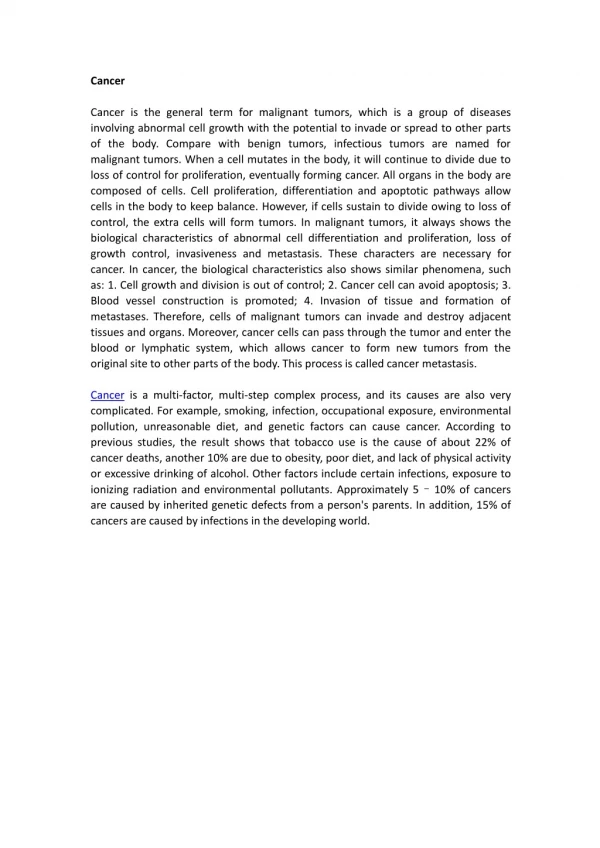
Cancer Tumor - abnormal growth of tissue • Benign tumors - self-contained, non-cancerous • Malignant tumors - tumors made of cells that continuously divide; cancerous
Characteristics of Malignant Cells • Divide continually (given space and nutrients) • Heritable mutations: cells with mutations have daughter cells which inherit the same mutations • Dedifferentiated: cells lose their specialized identity • Different appearance: reflects dedifferentiation • Lack of contact inhibition: divide in a crowd of cells and pile on top of each other • Induce angiogenesis (local blood vessel formation) • Increased mutation rate • Invasive: squeeze into any space available • Metastasize: cells move to new location in the body
Cancer Types • Sarcoma rises from connective tissue such as bone and is more common in younger people • Carcinoma occurs in epithelial tissue and is more common in older people; includes lung, breast, prostate, and colon cancer • Leukemia is thecancer of the blood or bone marrow • Lymphoma affects the lymphatic system
Cancer involves both inherited & environmental factors Inherited factors specific genes that predispose us to cancer Environmental factors factors that cause new mutations, such as: • Exposure to high levels ofradiation, including UV • Some viruses - Hepatitis B, Hepatitis C, Human Pappiloma Virus (HPV) • Smoking • Lack of physical activity • Other
What makes a normal cell turn into a malignant cell? Loss of the cell cycle control Regulation of the cell cycle involves: • Tumor supressing genes - encode proteins that normally function to inhibit cell division • Proto-oncogenes - encode proteins that promote cell division What can happen when some of these genes mutate? Uncontrolled cell division
Why does the chance of getting cancer increases as we get older? With more time passing, we are more likely to develop mutations in genes that code for proteins that control the cell cycle
Key Point Cancer results from the accumulation of a small number of independent mutations that ultimately lead to the loss of control over cell division
US Mortality, 2001 No. of deaths % of all deaths Rank Cause of Death 1. Heart Diseases 700,142 29.0 2. Cancer553,768 22.9 3. Cerebrovascular diseases 163,538 6.8 4. Chronic lower respiratory diseases 123,013 5.1 5. Accidents (Unintentional injuries) 101,537 4.2 6. Diabetes mellitus 71,372 3.0 7. Influenza and Pneumonia 62,034 2.6 8. Alzheimer’s disease 53,852 2.2 9. Nephritis 39,480 1.6 10. Septicemia 32,238 1.3 Source: US Mortality Public Use Data Tape 2001, National Center for Health Statistics, Centers for Disease Control and Prevention, 2003.
Change in the US Death Rates by Cause, 1950 & 2001 Rate Per 100,000 1950 2001 HeartDiseases CerebrovascularDiseases Pneumonia/Influenza Cancer * Age-adjusted to 2000 US standard population. Sources: 1950 Mortality Data - CDC/NCHS, NVSS, Mortality Revised. 2001 Mortality Data–NVSR-Death Final Data 2001–Volume 52, No. 3. http://www.cdc.gov/nchs/data/nvsr/nvsr52/nvsr52_03.pdf
2004 Estimated US Cancer Deaths Men290,890 Women272,810 Lung & bronchus 32% Prostate 10% Colon & rectum 10% Pancreas 5% Leukemia 5% Non-Hodgkin 4%lymphoma Esophagus 4% Liver & intrahepatic 3%bile duct Urinary bladder 3% Kidney 3% All other sites 21% 25% Lung & bronchus 15% Breast 10% Colon & rectum 6% Ovary 6% Pancreas 4% Leukemia 3% Non-Hodgkin lymphoma 3% Uterine corpus 2% Multiple myeloma 2% Brain/ONS 24% All other sites ONS=Other nervous system. Source: American Cancer Society, 2004.
2004 Estimated US Cancer Cases Men699,560 Women668,470 Prostate 33% Lung & bronchus 13% Colon & rectum 11% Urinary bladder 6% Melanoma of skin 4% Non-Hodgkin lymphoma 4% Kidney 3% Oral Cavity 3% Leukemia 3% Pancreas 2% All Other Sites 18% 32% Breast 12% Lung & bronchus 11% Colon & rectum 6% Uterine corpus 4% Ovary 4% Non-Hodgkin lymphoma 4% Melanoma of skin 3% Thyroid 2% Pancreas 2% Urinary bladder 20% All Other Sites *Excludes basal and squamous cell skin cancers and in situ carcinomas except urinary bladder. Source: American Cancer Society, 2004.
Cancer Death Rates by Sex and Race, US, 1975-2000 Rate Per 100,000 African-American men White men African-American women White women *Age-adjusted to the 2000 US standard population. Source: Surveillance, Epidemiology, and End Results Program, 1975-2000, Division of Cancer Control and Population Sciences, National Cancer Institute, 2003.
Lifetime Probability of Developing Cancer, by Site, Men, US, 1998-2000 Site Risk All sites 1 in 2 Prostate 1 in 6 Lung & bronchus 1 in 13 Colon & rectum 1 in 17 Urinary bladder 1 in 29 Non-Hodgkin lymphoma 1 in 48 Melanoma 1 in 55 Leukemia 1 in 70 Oral cavity 1 in 72 Kidney 1 in 69 Stomach 1 in 81 Source: DevCan: Probability of Developing or Dying of Cancer Software, Version 5.1 Statistical Research and Applications Branch, NCI, 2003. http://srab.cancer.gov/devcan
Lifetime Probability of Developing Cancer, by Site, Women, US, 1998-2000 Site Risk All sites 1 in 3 Breast 1 in 7 Lung & bronchus 1 in 17 Colon & rectum 1 in 18 Uterine corpus 1 in 38 Non-Hodgkin lymphoma 1 in 57 Ovary 1 in 59 Pancreas 1 in 83 Melanoma 1 in 82 Urinary bladder 1 in 91 Uterine cervix 1 in 128 Source:DevCan: Probability of Developing or Dying of Cancer Software, Version 5.1 Statistical Research and Applications Branch, NCI, 2003. http://srab.cancer.gov/devcan
Trends in Consumption of Five or More Recommended Vegetable and Fruit Servings for Cancer Prevention, Adults 18 and Older, US, 1994-2002 Note: Data from participating states and the District of Columbia were aggregated to represent the United States. Source: Behavioral Risk Factor Surveillance System CD-ROM (1984-1995, 1996, 1998) and Public Use Data Tape (2000), National Center for Chronic Disease Prevention and Health Promotion, Centers for Disease Control and Prevention, 1997, 1999, 2000, 2001.
Trends in Leisure-Time Physical Activity Prevalence (%), by Educational Attainment, Adults 18 and Older, US, 1992-2002 Adults with less than a high school education All adults Note: Data from participating states and the District of Columbia were aggregated to represent the United States. Educational attainment is for adults 25 and older. Source: Behavioral Risk Factor Surveillance System CD-ROM (1984-1995, 1996, 1998) and Public Use Data Tape (2000), National Center for Chronic Disease Prevention and Health Promotion, Centers for Disease Control and Prevention, 1997, 1999, 2000, 2001.
< 50% 50-55% >55% Did not participate in survey Trends in Overweight* Prevalence (%), Adults 18 and Older, US, 1992-2002 1995 1992 1998 2002 *Body mass index of 25.0 kg/m2or greater Source: Behavioral Risk Factor Surveillance System, CD-ROM (1984-1995, 1998) and Public Use Data Tape (2002), National Center for Chronic Disease Prevention and Health Promotion, Centers for Disease Control and Prevention, 1997, 2000, 2003.
50% of all cancers are preventable • Eat well balanced, low fat, high fiber diet • Eat antioxidants: beta-carotene, lycopene, vitamins A, C, E • Drink plenty of water • Maintain healthy weight • Play in the shade (especially from 10 am to 4 pm) • Be physically active • Limit alcohol consumption • Delay sexual intercourse and limit # of sexual partners • Stay away from tobacco and don’t breathe other people’s smoke • Breastfeed your babies • Have regular dentist and doctor check ups • Be happy