Download
1 / 1
10 likes | 111 Vues
Access daily updated 3D displacement data caused by atmospheric pressure loading for VLBI and SLR sites. Download available since 1976. For detailed comparisons and validation, visit the provided link.

E N D
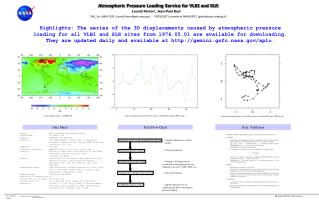
Atmospheric Pressure Loading Service for VLBI and SLR Leonid Petrov1, Jean-Paul Boy2 1 NVI, Inc./NASA GSFC (Leonid.Petrov@gsfc.nasa.gov), 2 IPGS/EOST (currently at NASA/GSFC) (jpboy@eost.u-strasbg.fr) Highlights: The series of the 3D displacements caused by atmospheric pressure loading for all VLBI and SLR sites from 1976.05.01 are available for downloading. They are updated daily and available at http://gemini.gsfc.nasa.gov/aplo. COMPARISONS USING DEM CELL resolution SUB-SAMPLING Vertical displacements of Greenbelt station in October/November 2003 in mm. Vertical displacement: 1/1/2000 at 0h. Horizontal displacements of Greenbelt station in October/November 2003 in mm. Data Sheet Data Flow Chart Data Validation Access: http://gemini.gsfc.nasa.gov/aplo Established: on 2002.12.12 Formats: EPHEDISP and BINDISP. Contents: 3-D displacement vectors due to atmosphere pressure loading for all SLR and VLBI sites from 1976.05.01 till now. Sampling: 6 hours. Frequency of update: updated daily at 2:00 a.m. local time. Latency: within 24 hours after availability of the NCEP Reanalysis surface pressure field (usually 4-6 days). Method: convolution of the surface pressure field with Green's function. The inverted barometer hypothesis was used for modeling the ocean response. Atmospheric model: NCEP Reanalysis surface pressure at 2.5x2.5 deg grid + Ponte-Ray (2002) model of diurnal and semidiurnal atmospheric tides. Land-sea mask: 0.25x0.25 deg FES99. Precision of computation: 1%. Uncertainty of the model: less than 15%. Estimated errors: 5% on average (from comparison with VLBI). Reference: Petrov, L., J.-P. Boy, Study of the atmospheric pressure loading signal in VLBI observations, accepted by J. Geophys. Res., 2004. National Centers for Environmental Prediction --- Computes Reanalysis weather model. --- Data dissemination. Climate Diagnostic Centers Goddard Space Flight Center --- Computes 3D displacement vectors due to atmospheric pressure loading for all active VLBI / SLR sites. Goddard Space Flight Center web site --- Data dissemination. VLBI/SLR analysis center --- Applies reduction for site displacements due to atmospheric pressure loading. Email:Leonid.Petrov@gsfc.nasa.gov AGU - FALL 2003 G72A-05 Information Contact: Leonid Petrov NVI, Inc./NASA GSFC