Download
1 / 52
520 likes | 666 Vues
Outlook for Major Crops United States Department of Agriculture. Presented to American Farm Bureau Atlanta, Georgia January 10, 2011 http://www.usda.gov/oce/speeches/index.htm. Wheat Cash Prices. Source: USDA-AMS. World Wheat Production. Global Wheat Production & Consumption.

E N D
Outlook for Major CropsUnited States Department of Agriculture Presented to American Farm Bureau Atlanta, Georgia January 10, 2011 http://www.usda.gov/oce/speeches/index.htm
Wheat Cash Prices Source: USDA-AMS.
World Wheat Production December 10, 2010
Global Wheat Production & Consumption Source: USDA-WAOB, World Agricultural Supply and Demand Estimates, December 10, 2010.
Major Exporter Wheat Ending Stocks Source: USDA-WAOB, World Agricultural Supply and Demand Estimates, December 10, 2010.
Russia Wheat and Coarse Production Source: USDA-WAOB, World Agricultural Supply and Demand Estimates, December 10, 2010.
Russia Wheat and Coarse Grain Feeding Source: USDA-WAOB, World Agricultural Supply and Demand Estimates, December 10, 2010.
Russia Wheat and Coarse Grain Exports Source: USDA-WAOB, World Agricultural Supply and Demand Estimates, December 10, 2010.
Russia Wheat Imports Source: USDA-WAOB, World Agricultural Supply and Demand Estimates, December 10, 2010.
Russia Wheat and Coarse Grain Ending Stocks Source: USDA-WAOB, World Agricultural Supply and Demand Estimates, December 10, 2010.
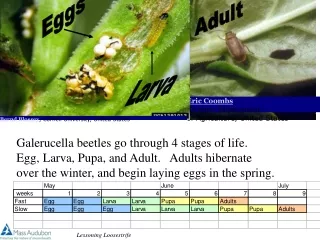
Season Summary Drought developed during the growing season, reducing winter wheat yield potential. Cool, wet weather in the South and East led to good to excellent crop prospects, offsetting production losses in the West.
Wet Weather Disrupted Wheat Harvest Recent, flooding rains are a concern, however, hampering winter wheat harvesting and reducing crop quality. December 10, 2010
U.S. Wheat Supply and Demand December 10, 2010
Corn Cash Prices Source: USDA-AMS.
World Corn Production December 10, 2010
Global Corn Production & Consumption Source: USDA-WAOB, World Agricultural Supply and Demand Estimates, December 10, 2010.
Global Corn Food, Seed, and Industrial Use Source: USDA-WAOB, World Agricultural Supply and Demand Estimates, December 10, 2010.
U.S. Corn Supply and Demand December 10, 2010
Renewable Fuel Standard Source: Energy Independence and Security Act of 2007.
U.S. Ethanol Production Capacity 2010 2011 2009 2008 2007 2006 Source: Production capacity from Renewable Fuels Association and USDA projections. RFS from Energy Independence and Security Act of 2007.
U.S. Corn Used for Ethanol Source: USDA-WAOB, World Agricultural Supply and Demand Estimates, December 10, 2010.
Ethanol Producer Net Returns Above Variable Costs 13 cents/gal. (12/30/10) Note: USDA-WAOB estimates based on USDA-AMS plant reports and DOE-EIA estimates and forecasts for natural gas and electricity prices.
Ethanol and RBOB Nearby Futures Prices Reformulate Gasoline Blend Stock (RBOB) Ethanol Note: Ethanol prices based on CBOT nearby futures. RBOB (Reformulated Gasoline Blend Stock) based on NYME nearby futures.
Ethanol and RBOB Nearby Futures Spreads 51-cent blender credit 45-cent blender credit Blending incentive (1/3/11) = $0.56 (Ethanol – RBOB) Note: Ethanol prices based on CBOT nearby futures. RBOB (Reformulated Gasoline Blend Stock) based on NYME nearby futures.
U.S. Weekly Gasoline ProductionAll Gasoline and Ethanol Blends Source: U.S. Dept. of Energy, Energy Information Administration.
U.S. Blended Motor Gasoline Consumption 7.9 bil. gal. Source: DOE-Energy Information Administration, Short-term Energy Outlook (STEO) and Annual Energy Outlook (AEO).
Soybean Cash Prices Source: USDA-AMS.
World Soybean Production December 10, 2010
U.S. Soybean Supply and Demand December 10, 2010
U.S. Soybean Oil Supply and Demand December 10, 2010
U.S. Domestic Biodiesel Margin Blending Credit Expired
U.S., Brazil, and Argentina Industrial Use Million Tons
U.S. Soybean Exports Billion Bushels
China Soybean Imports(From All Sources) Billion Bushels
World Cotton Production December 10, 2010
Agricultural Weather Assessments World Agricultural Outlook Board
Global Cotton Production and Consumption2001/02 through 2010/11 est. December 10, 2010
Global Cotton Ending Stocks2001/02 through 2010/11 est. December 10, 2010
U.S. Cotton Supply and Demand December 10, 2010
U.S. Cotton Planted Area2001 - 2010 December 10, 2010
New-crop Futures PricesAverages of December Settlement Prices 2008 crop 2009 crop 2011 crop 2010 crop Note: Corn and soybean prices from new-crop December and November CBOT futures contracts. HRW wheat prices from new-crop July KCBT futures contract.
New-crop Soybean/Corn Price Ratios2007-crop, 2009-crop, and 2011-crop thru Jan. 3, 2011 Soybean area expanded in 2009 Corn area expanded in 2007 Note: Chicago Board of Trade daily settlement prices.
Pre-planting Net Returns Outlook Note: For 2006-2010, net returns are above variable costs and reflect trend yields and USDA price and production cost forecasts as of February for the respective years. Projections for 2011 are based on USDA-ERS projected total operating costs for 2011 as of November 2010 and current Central Illinois corn and soybean cash forward bids for fall 2011 delivery (1/3/11). For wheat, gross revenue based on the currently quoted Western Kansas HRW cash forward bid for June/July 2011 delivery (1/3/11).
Retail Prices for Fertilizers in Illinois Source: USDA/AMS, Illinois Production Cost Report (Bi-weekly).