Download
1 / 11
110 likes | 249 Vues
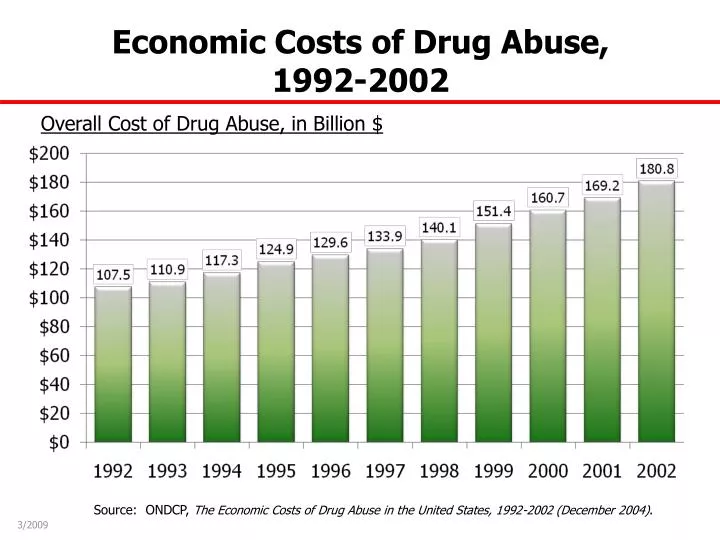
Overall Cost of Drug Abuse, in Billion $. Economic Costs of Drug Abuse, 1992-2002. Source: ONDCP, The Economic Costs of Drug Abuse in the United States, 1992-2002 (December 2004) . 3/2009. Number of Drug-Induced Deaths. Drug-Induced Deaths, 1979-2006.

E N D
Overall Cost of Drug Abuse, in Billion $ Economic Costs of Drug Abuse, 1992-2002 Source: ONDCP, The Economic Costs of Drug Abuse in the United States, 1992-2002 (December 2004). 3/2009
Number of Drug-Induced Deaths Drug-Induced Deaths, 1979-2006 In 1998, coding of causes of death transitioned from the World Health Organization standard International Classification of Diseases (ICD) -9 to ICD-10. Causes of death attributable to drugs include accidental or intentional poisonings by drugs, drug psychoses, drug dependence, and nondependent use of drugs. Drug-induced causes exclude accidents, homicides, and other causes indirectly related to drug use. Source: National Center for Health Statistics/CDC, National Vital Statistics Report, Final death data for each calendar year (April 2009). 3/2009
Drug AvailabilityEstimation All-source integration of data sets to create a consistent picture of the amount of drugs available in the United States . • Demand-Based Approach • Number of occasional (NSDUH) and hard-core (ADAM) drug users • Survey how much a drug user spends • Yields total expenditure for illegal drugs ($64B in 2000) • Price and purity of each illegal drug • Yields amount of drugs consumed in US • Supply-Based Approach • Cultivation and production of each drug • Reduce by amount seized • Or combine seizures with a seizure rate to yield flow amount • Reduce by non-US consumption • Remaining supply is amount available for US consumption
Assuming Steady Interdiction Resources, Southwest Border Seizures Provide Indication of Flow COCAINE HEROIN METH MARIJUANA Sources: SWB (NSS); All Federal (FDSS)
Cocaine Movement Events Departing South AmericaProvide View of Dynamic Trafficker Response to Interdiction • Interagency process initiated in 1992 to document all cocaine movement events departing South America • Primarily non-commercial movements • Data tabulated* on each movement includes conveyance, load size, intel cueing, and interdiction results • Trends: • Approx 1,100 metric tons (EQ) cocaine annually departing South America 2004-2006 • Trafficking shift from Caribbean to Mexico, but Venezuela increasing origin for aircraft • Shift from air movements (1991-1995), to go-fasts (1996-2006) to low profiles (2007-08) * Consolidated Counterdrug Data Base (CCDB)
Cocaine Price and Purity Trends Source: System To Retrieve Information on Drug Evidence (STRIDE,) DEA, April 2009
Potential Heroin Production Estimates Inconsistent with Signature Analyses of Street Purchases Source: Potential Production Estimates, US Government sources, 2008
2004 Number of Meth Lab Incidents Decreased Nationally Since 2004 2006 2008
Available online at: http://whitehousedrugpolicy.gov/publications/policy/ndcs09/ndcs09_data_supl/09datasupplement.pdf