Quadratic Functions
Quadratic Functions. FUNDAMENTAL COACHING CENTRE( FCC). Quadratic functions. A relation defined by the rule (where a ≠ 0 and a, b and c are constants) is called a quadratic function. e.g.

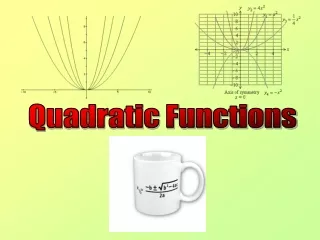
Quadratic Functions
E N D
Presentation Transcript
Quadratic Functions FUNDAMENTAL COACHING CENTRE( FCC)
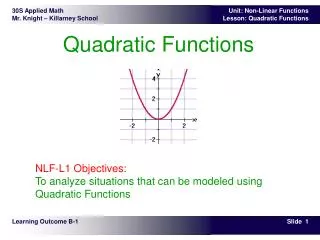
Quadratic functions A relation defined by the rule (where a ≠ 0 and a, b and c are constants) is called a quadratic function. e.g. In this section, we will learn the general characteristics of quadratic functions by plotting their graphs. Then these characteristics will be used to sketch other quadratic graphs.
Graphs of Example 1: Plot the graph of for -3 ≤ x ≤ 3 The parabola opens upwards. The minimum value of y is zero and it occurs when x = 0. The point(0, 0) is called the turning point or vertex of the parabola.
When we plot these points and join them with a smooth curve, we obtain the quadratic graph shown above. The curve is called a parabola. It has many applications in science and engineering. For example, the path followed by a projectile or the shape of the reflector in a car's headlamps or searchlights. Looking at the graph and the shape of the curve, you could imagine that a mirror is placed along the y-axis: the left-hand side and right hand side of the curve are mirror-images of each other. This property is called symmetry. We say that the graph is symmetrical about the y-axis, and the y-axis is called the axis of symmetry. So, the axis of symmetry has equation x = 0.
Example 2: Plot the graph of for -2 ≤ x ≤ 2 The graph is a parabolawhich opens upwards. The minimum value of y is 0 and it occurs when x = 0. The point (0, 0) is called the vertex of the parabola. The graph is symmetrical about x = 0, i.e. the y-axis.
Graphs of Example 3: Plot the graph of for -3 ≤ x ≤ 3 The graph is a parabola which opens downwards. Clearly, the graph is symmetrical about the y-axis.So, the equation of the axis of symmetry is x = 0.The maximum value of y is 0 and it occurs when x = 0.The vertex (or turning point) of the parabola is the point (0, 0).
Example 4: Plot the graph of for -2 ≤ x ≤ 2 The graph is a parabola which opens downwards.Clearly, the graph is symmetrical about the y-axis. So, the equation of the axis of symmetry is x = 0.The maximum value of y is 0 and it occurs when x = 0.The vertex of the parabola is the point (0, 0).
Graphs of Example 5: Plot the graph of for -2 ≤ x ≤ 2 The graph is a parabolawhich opens upwards. Clearly, the graph is symmetrical about the y-axis. So, the equation of the axis of symmetry is x = 0.The minimum value of y is 3 and it occurs when x = 0.The vertex of the parabola is the point (0, 3).
Graphs of Example 6: Plot the graph of for -3 ≤ x ≤ 3 The graph is a parabola which opens downwards. Clearly, the graph is symmetrical about the y-axis. So, the equation of the axis of symmetry is x = 0.The maximum value of y is 1 and it occurs when x = 0.The vertex of the parabola is the point (0, 1).
Graphs of Example 7: Plot the graph of for 0 ≤ x ≤ 4 The graph is a parabola which opens upwards.The graph is symmetrical about the line x = 2. So, the equation of the axis of symmetry is x = 2.The minimum value of y is 0 and it occurs when x = 2.The vertex of the parabola is (2, 0).
Graphs of Example 8: Plot the graph of for 0 ≤ x ≤ 4 The graph is a parabola which opens downwards.The graph is symmetrical about the line x = 2. So, the equation of the axis of symmetry is x = 2.The maximum value of y is 0 and it occurs when x = 2.The vertex of the parabola is (2, 0).
Graphs of Example 9: Plot the graph of for -1 ≤ x ≤ -3 The graph is a parabola which opens upwards.The graph is symmetrical about the line x = 1. So, the equation of the axis of symmetry is x = 1.The minimum value of y is 2 and it occurs when x = 1.The vertex of the parabola is (1, 2).
Graphs of Example 10: Plot the graph of for -1 ≤ x ≤ -3 The graph is a parabola which opens downwards.The graph is symmetrical about the line x = 1. So, the equation of the axis of symmetry is x = 1.The maximum value of y is 2 and it occurs when x = 1.The vertex of the parabola is (1, 2).
Quadratic graphs by transformations It is useful to consider some graphs as the dilation, translation or reflection of a basic graph. Dilation and Reflection Dilation has the effect of stretching or compressing a graph. Dilation is either from the x-axis or they-axis. Also, it could be from both axes.
Consider the graphs of the following functions on the same set of axes:
Translation A translation is a shift of a graph in a given direction. Consider the graphs of the following functions on the same set of axes:
Graphs of y = (x - b)² Consider the graphs of the following functions on the same set of axes:
Example 11: Sketch the graph of Solution:
Sketching Parabolic Graphs • turning point • axis of symmetry • x-intercepts • y-intercept
Example 12: Sketch the graph of Solution:
x- intercepts: y –intercepts: The minimum value of y is – 4.
Problem solving The graph of a quadratic function has the shape of a parabola. Parabolas have many applications in engineering and science. For example, radar, antennas and the paths of projectiles are parabolic. Example 15: The rate of a chemical reaction, v, involving the transformation of one compound into another compound is given by
where x is the concentration of the new compound. What value of x results in the maximum value of v, and what is the maximum value? Solution: So, the maximum value of v is 9 and it occurs when x = 3.
Example 16: A farmer wants to build a fence around a rectangular paddock using the straight edge of a canal as one side. She has 400 m of fencing and wants to enclose the maximum area. a. If the width of the paddock is x m, express the:(i) length, l, of the paddock in terms of x(ii) area, A, of the paddock in terms of x b. Express A in square completion form.c. Sketch the graph of A showing all key features.d. Determine the length and width of the paddock for its area to be maximised.
c. The graph is a parabola opening downwards with axis of symmetry x = 100 and vertex at (100, 20000). x-intercepts: A-intercept:
Quadratic Inequalities If the highest power of the unknown in an inequality is 2, then it is known as a quadratic inequality. To solve a quadratic inequality, let the quadratic expression be equal to y , sketch a graph of y against x, and then from the graph, read off the x-values __ satisfy the inequality.
Example 17: Solve Solution: x-intercept: y-intercept: From the graph we find that y is positive, when x < 1 or x > 6
Simultaneous equations The simultaneous solution of a linear equation and a quadratic equation is given by the point or points of intersection of the line and parabola representing the equations. To find the solution, eliminate y (or x) by substitution; and solve the quadratic equation thus formed in x (or y). Then find the corresponding value(s) of y (or x).
Example 19: Solve the following simultaneous equation: Solution:
Example 20: Solve the following simultaneous equations Solution:
Problem Solving II • Some practical problems involving two unknowns are solved by finding the simultaneous solution of a linear and a quadratic equation. To solve such problems we proceed as follows: • Let the two unknowns be x and y. • Use the information provided in the problem to write two simultaneous equations and solve the equations for x and y. • Check the reasonableness of the solution and then state the answer in words.
Example 21: If the length of a rectangular kitchen is half the square of its width and its perimeter is 48 m, find the dimensions of the kitchen. Solution: Example 21: If the length of a rectangular kitchen is half the square of its width and its perimeter is 48 m, find the dimensions of the kitchen. Solution:
Sketching quadratic inequalities Theparabola divides the Cartesian plane into two regions. One region is above the parabola and the other is below the parabola.
Example 22: Solution:
x-intercepts y-intercepts Test point
Example 23: Solution:
x-intercepts: y-intercept: Test point:
Intersection of half planes The region common to two or more inequalities is useful in the study of linear programming; and it can be depicted on the Cartesian plane as illustrated in the following example. Example 24:
x-intercepts: y-intercept: Solution: x-intercept: y-intercept:
The points of intersection are obtained by solving the simultaneous equations:
Problem solving unit Problem 13.1 A Spider and a Well A spider is at the bottom of a well. Each morning she spins a web to ascend 2 m up the well's wall, and then during the day she slips 1 m down the wall. If the well is 10 m deep, how long will it take for the spider to get out of the well? You must justify your answer by using diagram(s) and/or tables.
Problem 13.2 Lockers • A school in a certain remote area has five lockers that are numbered 1, 2, 3, 4 and 5. On the first day of the first term, the first student on the roll runs through the corridor and opens every locker. The second student shuts every second locker, the third student changes every third locker (i.e. opens it if it is shut, shuts it if it is open), the fourth student changes every fourth locker, and the fifth student changes every fifth locker.
a. Which of the lockers are left open? • b. Extend the question stated in part (a) to:(i) 10 lockers and 10 students(ii) 20 lockers and 20 students(iii) 30 lockers and 30 students(iv) 50 lockers and 50 students(v) 101 lockers and 101 students(vi) 1000 lockers and 1000 students • Is there a pattern between the number of students and the number of open lockers?Generalise the above result assuming that there are n students.