Download
1 / 28
280 likes | 558 Vues
Grade 8 Algebra1 Linear, Quadratic, and Exponential Models. Warm Up. Solve by using square roots. 1) 4x 2 = 100. 2) 10 - x 2 = 10. 3) 16x 2 + 5 = 86. 3) 9 , - 9 4 4. 2) 0. 1) 5, -5. Linear, Quadratic, and Exponential Models.

E N D
Grade 8 Algebra1Linear, Quadratic, and Exponential Models CONFIDENTIAL
Warm Up Solve by using square roots. 1) 4x2 = 100 2) 10 - x2 = 10 3) 16x2 + 5 = 86 3) 9 , -9 4 4 2) 0 1) 5, -5 CONFIDENTIAL
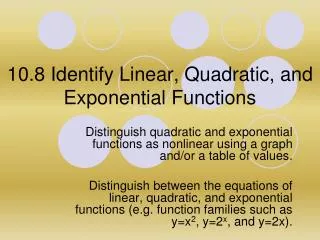
Linear, Quadratic, and Exponential Models Look at the tables and graphs below. The data show three ways you have learned that variable quantities can be related. The relationships shown are linear, quadratic, and exponential. CONFIDENTIAL
In the real world, people often gather data and then must decide what kind of relationship (if any) they think best describes their data. CONFIDENTIAL
Graphing Data to Choose a Model Graph each data set. Which kind of model best describes the data? A) Plot the data points and connect them. The data appear to be exponential. CONFIDENTIAL
B) Plot the data points and connect them. The data appear to be linear. CONFIDENTIAL
Now you try! Graph each data set. Which kind of model best describes the data? • { (-3, 0.30) , (-2, 0.44) , (0, 1) , (1, 1.5) , (2, 2.25) , (3,3.38} • 2){(-3, -14) , (-2, -9) , (-1, -6) , (0, -5) , (1, -6) , (2, -9) , (3, -14)} 1) exponential 2) quadratic CONFIDENTIAL
Another way to decide which kind of relationship (if any) best describes a data set is to use patterns. CONFIDENTIAL
Graphing Data to Choose a Model Look for a pattern in each data set to determine which kind of model best describes the data. A) For every constant change in distance of +100 feet, there is a constant second difference of +32. The data appear to be quadratic. CONFIDENTIAL
B) For every constant change in age of +1 year, there is a constant ratio of 0.85. The data appear to be exponential. CONFIDENTIAL
Now you try! 1) Look for a pattern in the data set {(-2, 10) , (-1, 1) , (0, -2) , (1, 1) , (2, 10)} to determine which kind of model best describes the data. 1) quadratic CONFIDENTIAL
General Forms of Functions After deciding which model best fits the data, you can write a function. Recall the general forms of linear, quadratic, and exponential functions. CONFIDENTIAL
Problem-Solving Application Use the data in the table to describe how the ladybug population is changing. Then write a function that models the data. Use your function to predict the ladybug population after one year. Determine whether the data is linear, quadratic, or exponential. Use the general form to write a function. Then use the function to find the population after one year. CONFIDENTIAL
Step 1: Describe the situation in words. Each month, the ladybug population is multiplied by 3. In other words, the population triples each month. CONFIDENTIAL
Step 2: Write the function. There is a constant ratio of 3. The data appear to be exponential. Write the general form of an exponential function. y = abx y = a(3)x Substitute the constant ratio, 3, for b. Choose an ordered pair from the table, such as (0, 10) . Substitute for x and y. 10 = a(3)x 10 = a (1) Simplify. 30 = 1 10 = a The value of a is 10. y= 10(3)x Substitute 10 for a in y = a (3)x . CONFIDENTIAL
y = 10(3)x y = 10(3)x y = 10(3)x 270 10(3)3 30 10(3)1 90 10(3)2 90 10(9) 270 10(27) 30 10(3) 270 270 30 30 90 90 Step 3: Predict the ladybug population after one year. y = 10(3)x Write the function. y = a(3)12 Substitute 12 for x (1 year = 12 mo). Use a calculator. = 5,314,410 You chose the ordered pair (0, 10) to write the function. Check that every other ordered pair in the table satisfies your function. CONFIDENTIAL
Now you try! 1) Use the data in the table to describe how the oven temperature is changing. Then write a function that models the data. Use your function to predict the temperature after 1 hour. 1) The oven temperature decreases by 500 every 10 minutes. Y = -5x – 375. 750 F. CONFIDENTIAL
Assessment Graph each data set. Which kind of model best describes the data? 1) {(-1, 4) , (-2, 0.8) , (0, 20) , (1, 100) , (-3, 0.16)} 2) {(0, 3) , (1, 9) , (2, 11) , (3, 9) , (4, 3)} 3) {(2, -7) , (-2, -9) , (0, -8) , (4, -6) , (6, -5)} • exponential • 2) quadratic • 3) linear CONFIDENTIAL
Look for a pattern in each data set to determine which kind of model best describes the data. 4) {(-2, 1) , (-1, 2.5) , (0, 3) , (1, 2.5) , (2, 1)} 5) {(-2, 0.75) , (-1, 1.5) , (0, 3) , (1, 6) , (2, 12)} 6) {(-2, 2) , (-1, 4) , (0, 6) , (1, 8) , (2, 10)} 4) quadratic 5) exponential 6) linear CONFIDENTIAL
7) Use the data in the table to describe the cost of grapes. Then write a function that models the data. Use your function to predict the cost of 6 pounds of grapes. 7) Y = 1.79x. Grapes cost = 1.79/lb, $10.74 CONFIDENTIAL
Let’s review Linear, Quadratic, and Exponential Models Look at the tables and graphs below. The data show three ways you have learned that variable quantities can be related. The relationships shown are linear, quadratic, and exponential. CONFIDENTIAL
In the real world, people often gather data and then must decide what kind of relationship (if any) they think best describes their data. CONFIDENTIAL
Graphing Data to Choose a Model Graph each data set. Which kind of model best describes the data? A) Plot the data points and connect them. The data appear to be exponential. CONFIDENTIAL
B) Plot the data points and connect them. The data appear to be linear. CONFIDENTIAL
Graphing Data to Choose a Model Look for a pattern in each data set to determine which kind of model best describes the data. A) For every constant change in distance of +100 feet, there is a constant second difference of +32. The data appear to be quadratic. CONFIDENTIAL
General Forms of Functions After deciding which model best fits the data, you can write a function. Recall the general forms of linear, quadratic, and exponential functions. CONFIDENTIAL
You did a great job today! CONFIDENTIAL