Economic Tools for Broadband Policy
660 likes | 820 Vues
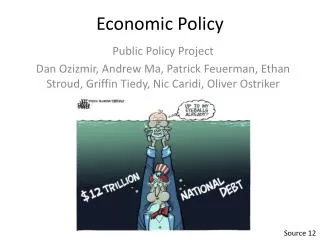
Economic Tools for Broadband Policy. George S. Ford Chief Economist. PHOENIX. CENTER. The 800 Pound Gorilla …. REGULATION V. Limited Competition. The 800 Pound Gorilla …. Markets Never Work. Markets Never Fail. complainers V. Idealogues. The 800 Pound Gorilla ….

Economic Tools for Broadband Policy
E N D
Presentation Transcript
Economic Tools for Broadband Policy George S. Ford Chief Economist PHOENIX CENTER
The 800 Pound Gorilla … REGULATION V. Limited Competition
The 800 Pound Gorilla … Markets Never Work Markets Never Fail complainers V. Idealogues
The 800 Pound Gorilla … Those of us who are amazed at how ridiculous the arguments have become.
Realistic Expectations • We need to form realistic expectations about … • Market Structure (how many firms) • Nature of Competition • Effect of Competition on Investment and Innovation • The Relationship between Communications Infrastructure and Economic Activity • The Efficacy of Regulation • What Markets Do • What the Data Tells Us
Market Structure • N* is Few • N ≈ 2 is not an unrealistic expectation for terrestrial, wireline networks • It appears that N ≈ 3 to 5 is right for wireless communications • “Nearby” competitors (wifi, wimax) offer additional limits to market power
N*: Equilibrium Number of Firms Firms enter until the next entrant loses money When entry stops, and exit does not occur, we have equilibrium N* depends on the size of the market, the fixed/sunk cost of entry, and the intensity of competition
Numerical Example:Policy Paper No. 21 The Equilibrium Number of Firms is 3. If the 4th firm enters, all firms lose money. All make money at 3, so this is the equilibrium.
Numerical Example:Policy Paper No. 21 The Equilibrium Number of Firms is 5. If the 6th firm enters, all firms lose money. All make money at 5, so this is the equilibrium.
Numerical Example:Policy Paper No. 21 The Equilibrium Number of Firms is 6. If the 7th firm enters, all firms lose money. All make money at 6, so this is the equilibrium.
Competition Price A PM MC 0 Collusion Cournot Bertrand 1 2 3 4 5 N General view is the price falls as the number of firms increases This is the Cournot View with Homogeneous Goods Or, Bertrand with Product Differentiation The full range of outcomes is possible theoretically
Competition and N • There’s a Difference: • Intensity of Competition • Number of Firms • The Intensity of Competition relates to how firms interact • Price reductions from additional firms is based on more firms competing, not necessarily a change in the way they behave with respect to price • Intensity is behavior, not count, and too much intensity leads to very few firms
The Evidence 75% were Cournot or Better. Can we form a general expectation about the intensity of rivalry? Empirical studies are mixed Experimental work suggests the tendency is Cournot or better.
Interpreting the Evidence More Like Cournot More Like Bertrand • Price is inversely related to industry concentration • P = f(HHI) • P = f(N) • Price is not related to industry concentration for 3 or more firms • P≠f(HHI) • P≠f(N) • Price cut occurs at 2nd firm. • Difficult to distinguish between Cournot with only 2 firms. • Also difficult to differentiate when N gets large
Too Much Competition? • Policy Paper No. 24: Network Neutrality and Industry Structure • Argument: If differentiation is prohibited by rule, firms are homogeneous, leaving only price to compete over. • Intense price competition can deter entry, leaving monopoly and no price competition at all. • Paradox • Differentiation softens price competition, but allows for price competition.
What’s the Benchmark?N* = 2 Price PM P2 P5 MC 0 Cournot 1 2 3 4 5 N • Perfect Competition • Marginal Cost = MC • Five Firms • P5 • Equilibrium Industry Structure • P2 is as low as it goes • Profit ≈ 0 • N=3, Profit < 0
What’s the Benchmark?N* = 2 $ Equilibrium N=2 P2 MC 0 Avg. Cost a c b d Firm Demand q • Perfect Competition • Marginal Cost = MC • Profits = 0 • Marginal Cost Pricing Not Possible • Losses = abcd • Equilibrium Industry Structure • Can only satisfy zero profit condition with fixed/sunk costs • MC Pricing not possible without massive subsidies
The 800 Pound Gorilla … REGULATION V. Limited Competition
Competition and Investment/Innovation Rate of Innovation Maximum Competition Investment and Innovation are higher with competition, up to a point Effect 1. Monopolies have the profits to fund innovation, but face no pressure to do so. Effect 2. Competition reduces profits, but firms innovate to escape competition (create market power). *Aghion et al, Competition, Imitation and Growth with Step-by-Step Innovation, Review of Economic Studies (2001).
Efficacy of Regulation(and it’s role) How good is regulation in a Monopoly setting? How good is regulation in a Duopoly setting? How good is regulation in a Triopoly setting? And so forth? Is limited competition better than regulation? What can regulation improve in a setting of limited competition? What the role of regulation if we have N* and its small? What N* = 2, Profit = 0, yet there is collusion?
Congress’ View:The Cable Act of 92 • 1992 Cable Act deregulated a cable system when it had a competitor that passed 50% of its market (and had a penetration rate of at least 15%). • Deregulate at 1.5 firms • Small systems were also unregulated • Benefits < Costs • Unbundling/Special Access • Triggers (a bit nutty)
Successes and Failures Cable Regulation – Failure Special Access – Failure Unbundling – Failure Interconnection Reform – Failure USF – Broken? Broadband Ubiquity by 2007 – Failure Payphone Compensation – Repeated Failure Wireless E911 - Failure Madison River? Part 68 Rules – Success (Monopoly Period) Number portability wireline, wireless, but not between – Success E911, Wireline and VOIP, not wireless – Success Spectrum Auctions – Success Other …. How do we pick successful interventions?
Special Access Profit Margins Pricing Flexibility/ Deregulation
Madison River • VOIP-Capable DSL = $30 • VOIP-Blocked DSL = $20 • FCC Says No VOIP-Blocking, or No Price Differences • VOIP-Capable DSL = $25 (or something like that) • Now everyone pays $25, where many would prefer to pay $20 • Under plausible conditions, such a decision is welfare reducing (consumer welfare reducing!) Difference is opportunity cost of lost profit from phone service.
Regulation versus Limited Competition • A little competition probably wins this battle. • Regulation is typically for things that the market cannot fix (Externalities, Natural Monopoly, Social Programs). • Price and Quality are the purview of the market. • Firms can impede competition • Perfection is not possible by regulators or markets, because perfection is subjective. • Firms typically meet the average needs (cost-benefit test) • Some Won’t be Happy Who’s driving policy today?
Be Realistic About Markets • Markets don’t resolve problems in an instant • It is the loss of a large number of customers that reveals a bad business decision. That takes time. • Complaints and news articles are the manifestation of this emigration. It is often evidence the market is working, not failing. • There will be complaints – people complain incessantly about Wal-Mart. Some people complain about their Toyota or Honda, despite being highly reliable, affordable autos. • Complaining is not evidence of market failure. • Service prices and quality YOU or I don’t like is not market failure.
Be Realistic About Markets • Home Networking • Network Neutrality proponents use as example • Market eventually solved it without regulation • Bluetooth Crippling • Another Net Neutrality example • Market solved it • WIFI Crippling • Another Net Neutrality example • Market solved it Firms are out for profits, so expect manifestations of that. But consumers are out for the best deal, and expect that discipline. Watch for long-term problems.
What About the Evidence? A Review of Broadband Comparisons and Rankings
Broadband Rankings What should our broadband ranking be?
Broadband Rankings What are the policy ramifications of our rank?
Normalization of Subscription Counts OECD ranks subscriptions per capita Per Capita is a reasonable choice for normalization, but it is not an innocuous adjustment. Any adjustment introduces error; may not make much of a difference, but it may. Home A: 4 people Home B: 3 people If both have a broadband, then Home A has a subscription rate of 25 while Home B has a subscription rate of 33. Household normalization helps, but does not control for businesses.
Normalization United States Sweden The U.S. needs 35% more connections than Sweden to make up the difference. Persons per Home = 2.7 Persons per Home = 2.0
High Rank for Communications Some countries tend to rank high in per-capita communications consumption. The U.S. presently ranks 24th in telephone per capita (wireless and wireline). Over the period 1991-1998, we ranked about 7th. After 1998, the U.S. has fallen to quickly to the low 20’s (presumably due to mobile phones and different counting schemes). Who ranks high?
Time and Subscription Measure At Time t0 Measure At Time t1 Subscription Rate A fall in rank may suggest leadership. Must have some guesstimate of terminal subscription for rank to relevant. Time
Household Penetration of Broadband:US and EU OECD Members Complaint: Different studies/methodologies. But, where does the OECD data come from? Source: EU Commission, E-Communications Household Survey (Apr. 2007). U.S. from Pew Internet and American Life Project (2007).
Determinants of Broadband Subscription The Broadband Nirvana ignores the impact of income, age, density, and so forth on subscription. Phoenix Center Policy Paper No. 29 measures the impact of a wide range of determinants of broadband subscription to assess whether or not countries are exceeding, meeting, or falling short of “expectations.” Relevant determinants are: Price (-), Income (+), Income inequality (-), Education (+), Age (-), Density (+), Phones (+), Business Size (-), Time (+).
Regression Analysis Algebra: y = a + bx Econometrics: Regression y y We try to fit the curve to “messier” data 25 20 15 10 5 25 20 15 10 5 y = 30 – 5x x x 0 1 2 3 4 5 0 1 2 3 4 5
Regression Analysis Univariate Regression y = a + bx Multivariate Regression: y = a + bx + cz y y 25 20 15 10 5 25 20 15 10 5 x x 0 1 2 3 4 5 0 1 2 3 4 5
Effect Size of Determinants AGE65 Japan = 26.9% AGE65 Korea = 12.4%
Broadband Policy 90% of differences in broadband subscription across OECD is explained by non-policy factors
Broadband Performance Index(Alternative Specification) Exceeds Expectations Meets Expectations Below Expectations
What Should We Rank? • Estimate the BPI regression only for the top 15 of OECD countries excluding the U.S. • Coefficients are driven by the most successful countries • U.S. Ranks 10th • Absent reformulations of the counting schemes across countries (like for wireless), the U.S. should rank about 10th in subscriptions per capita • This is roughly consistent with its rank for telephones/pop before wireless
From Rank to … • The rank statistics often precedes claims about • Lack of deployment • Lack of Bandwidth/Speed • Ubiquitous availability might move us up 4 spots in the rankings • Assuming 10% unavailability, we go from a subscription rate of 0.196 to 0.218. • Assuming 5% unavailability, we go up 3 spots.
Does Speed Matter? At $30, the high-value customer buys broadband at any speed. Speed must be 6Mbps for the low-value customers to buy. POINT: Higher speeds impact only marginal users. Higher speeds will only draw in the marginal users Those that want speed the most have already subscribed to broadband Speed is unlikely to increase our broadband ranking, or reduce it
Speed and Subscription:No Help Here After about here, the additional impact of speed on subscription is trivial. Subscription Rate For OECD countries, advertised speeds (provided by ITIF) are unrelated to broadband subscription rates in a well specified model. Speed