Download
1 / 14
200 likes | 599 Vues
Structure of a Waiting Line System. Queuing theory is the study of waiting lines Four characteristics of a queuing system: The manner in which customers arrive (bulk, individual, by appointment or randomly) The time required for service The priority for determining order of service

E N D
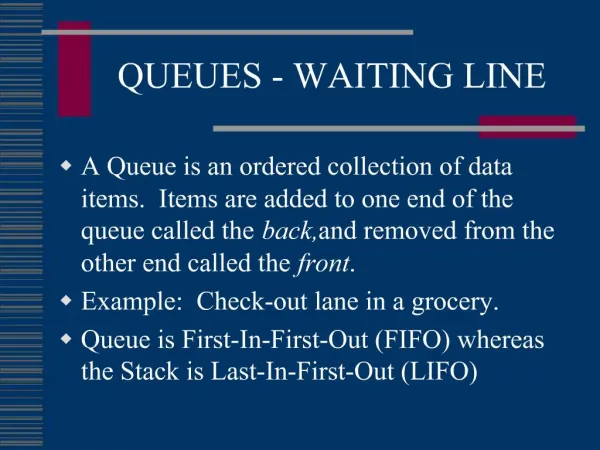
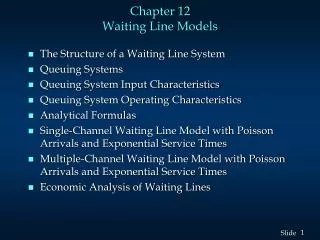
Structure of a Waiting Line System • Queuing theory is the study of waiting lines • Four characteristics of a queuing system: • The manner in which customers arrive (bulk, individual, by appointment or randomly) • The time required for service • The priority for determining order of service • The number and configuration of servers in the system
Structure of a Waiting Line System • In general, arrival of customers into a system is a random event. Frequently the arrival pattern is modeled as a Poisson process. • Service time is also usually a random variable. It is often described by the exponential distribution. • The most common queue discipline is FIFO. An elevator however would use LIFO and an emergency room would use a highest cost criterion.
Queuing Systems • A three part code A/B/s is used to describe various queuing systems where • A describes the arrival distribution assumed • B describes the service distribution assumed • s is the number of channels (servers) per line
Operating Characteristics of a Queuing System • What is the average wait time of the customer in the queue? In the system? • What is the average number of customers in the queue? In the system? • What percent of time is the service facility idle? What is the average amount of server free time between customers? • What is the probability that an arriving customer will have to wait?
Example: Wayne International Airport • Whenever an international plane arrives at the airport, two customs inspectors on duty set up operations to process the passengers. • Incoming passengers must first have their passports and visas checked. This is handled by one inspector. The time required to check a passenger's passports and visas can be described by the probability distribution on the next slide.
Example: Wayne International Airport • Random Number Mapping Time Required to Check a Passenger's Random Passport and VisaProbabilityNumbers 20 seconds .20 00 -19 40 seconds .40 20 - 59 60 seconds .30 60 - 89 80 seconds .10 90 - 99
Example: Wayne International Airport After having their passports and visas checked, the passengers next proceed to the second customs official who does baggage inspections. Passengers form a single waiting line with the official inspecting baggage on a first come, first served basis.
Example: Wayne International Airport • Random Number Mapping Time Required For Random Baggage InspectionProbabilityNumbers No Time .25 00 - 24 1 minute .60 25 - 84 2 minutes .10 85 - 94 3 minutes .05 95 - 99
Example: Wayne International Airport • Next-Event Simulation Records For each passenger the following information must be recorded: • When his service begins at the passport control inspection • The length of time for this service • When his service begins at the baggage inspection • The length of time for this service
Example: Wayne International Airport A chartered plane from abroad lands at Wayne Airport with 80 passengers. Simulate the processing of the first 10 passengers through customs using the random numbers given on the next slides.
Example: Wayne International Airport Passport ControlBaggage Inspections Pass. Time Rand. Service Time Time Rand. Service Time Num . Begin Num. Time End Begin Num. Time End 1 0:00 93 1:20 1:20 1:20 13 0:00 1:20 2 1:20 63 1:00 2:20 2:20 08 0:00 2:20 3 2:20 26 :40 3:00 3:00 60 1:00 4:00 4 3:00 16 :20 3:20 4:00 13 0:00 4:00 5 3:20 21 :40 4:00 4:00 68 1:00 5:00
Example: Wayne International Airport Passport ControlBaggage Inspections Pass. Time Rand. Service Time Time Rand. Service Time Num . Begin Num. Time End Begin Num. Time End 6 4:00 26 :40 4:40 5:00 40 1:00 6:00 7 4:40 70 1:00 5:40 6:00 40 1:00 7:00 8 5:40 55 :40 6:20 7:00 27 1:00 8:00 9 6:20 72 1:00 7:20 8:00 23 0:00 8:00 10 7:20 89 1:00 8:20 8:20 64 1:00 9:20
Example: Wayne International Airport • Question How long will it take for the first 10 passengers to clear customs? • Answer Passenger 10 clears customs after 9 minutes and 20 seconds.
Example: Wayne International Airport • Question What is the average length of time a customer waits before having his bags inspected after he clears passport control? How is this estimate biased? • Answer For each passenger calculate his waiting time: (Baggage Inspection Begins) - (Passport Control Ends) =0+0+0+40+0+20+20+40+40+0 = 160 seconds. 160/10 = 16 seconds per passenger. This is a biased estimate because we assume that the simulation began with the system empty. Thus, the results tend to underestimate the average waiting time.