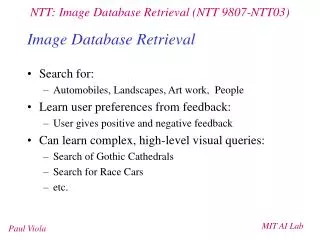
Bridging Image and Audio Retrieval Techniques: A Study on Classification and Processing
This paper explores the adaptation of image retrieval and classification techniques to audio processing. By applying proven image methods to the one-dimensional nature of audio, we aim to improve audio retrieval outcomes. We investigate various histogramming approaches and the effectiveness of wavelet transformations compared to traditional techniques. The study includes a novel dataset with ground truth, utilizing diverse music genres. Results indicate that while performance varies with band choice, image processing strategies can successfully enhance audio retrieval capabilities.

Bridging Image and Audio Retrieval Techniques: A Study on Classification and Processing
E N D
Presentation Transcript
Audio Meets Image Retrieval Techniques Dave Kauchak Department of Computer Science University of California, San Diego dkauchak@cs.ucsd.edu
Image vs. Audio ? ? ? ? ? ? Rock Classical Country
Image techniques to audio • Idea: Apply image retrieval (and classification) techniques to audio • Image is 2-D • Audio is 1-D
Benefits • Don’t have to reinvent the wheel • Image techniques have had fairly good success • More literature in image processing • Audio retrieval is a relatively new field
Key Concepts and Goals • Image techniques to audio processing • Apply a number of different image techniques (and show they work ) • Relate various parts of audio to counterparts in image • Novel data set with known ground truth • Multiple input for audio • Raw audio
A first step… • Audio retrieval • Input: A number of songs • Output: “Similar” songs from an audio database • Histogramming methods (Puzicha et. al.) • Wavelets instead of gabor filters
Basic Technique histogram Database DWT Most “similar” songs
Normal vs. Proportional Histogramming • Remember DWT: • Different number of samples per level • Normal: Histogram each level with same number of bins • Proportional: Histogram each level keeping samples/bin equal
Compare Histograms • Chi-square on each level • Sum chi-square value and use for dissimilarity measure (lower the better) • Sum dissimilarity over all input songs
Ground Truth Data Set • Songs by 4 different bands (10 songs each) • Dave Mathews band • U2 • Blink 182 • Green Day • Mono, sampled at 22 KHz from a number of sources
Experiment • Input = 5 songs by a single band • Goal = Pull out 5 other songs by that band • 10 random experiments per band (40 total) • Normal bins: 8, 16, 32, 64, 128, 192, 256, 320, 384, 448, 512 • Proportional bins: 4, 8, 16, 32, 64
Scoring • By points: • 5 pts. Correct answer in first place • 4 pts. Correct answer in second place, etc. • Perfect = 5+4+3+2+1 = 15 • Percentage correct at each place • Percentage that have correct answer less than or equal to place
Summary of Results • Overall, results are not amazing • Band choice has large influence • Normal and Proportional perform somewhat similar • Proportional is more even over all bands • Bin size doesn’t appear to be crucial • 75% of a chance a song by the same band will end up in top 5
Next Step… • Adaptive Binning • Vary Parameters • Levels • Song length • Histogram comparison methods • Another image retrieval algorithm • Boosting for feature selection using large feature set? • Other? • Larger and more diverse database
Conclusion • Even though results are not fabulous, image processing techniques CAN be used for audio processing • Using bands for testing allows for ground truth • Audio files are BIG!