Download
1 / 37
370 likes | 557 Vues
Travel Modeling at MTC. David Ory (dory@mtc.ca.gov) Metropolitan Transportation Commission November 17 and 18, 2011 Presentation to Triangle Region Model Expert Panel. Day 1. Image source: flickr.com/Michael Caven. Technical features. Data collection and management.

E N D
Travel Modeling at MTC David Ory (dory@mtc.ca.gov) Metropolitan Transportation Commission November 17 and 18, 2011 Presentation to Triangle Region Model Expert Panel
Day 1 Image source: flickr.com/Michael Caven
Technical features. • Data collection and management. • Time frame for model development. • Key questions.
Technical features. • Data collection and management. • Time frame for model development. • Key questions.
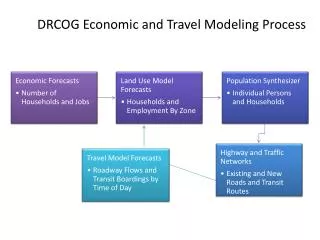
Space • 1454 TAZs ~ Census tracts • Each TAZ includes three non-spatial activity sub-zones: short-walk to transit, long-walk to transit, cannot walk to transit – activities occur in one of these three sub-zones • Time • Activities are scheduled hourly, between 5 am and midnight • Roadway and transit supply is represented for five time periods: 3 am to 6 am; 6 am to 10 am; 10 am to 3 pm; 3 pm to 7 pm; 7 pm to 3 am • Creation of agents • ARC Population Synthesizer (w/ 304 household-level control categories in the base year) • Land use • Association of Bay Area Governments • UrbanSim and PECAS models under-development
Google SF CBD Zone X Not work Work School 1Tour 1 Tour Not school Two cars Work and school locations selected Worker or student status (from census) Daily activity patterns chosen jointly Mandatory tours generated Household auto ownership level chosen
2 Joint Tours Zoo, Market 8 to 11; 3 to 4 7 to 7 8 to 4 1 At-work Tour McDonald’s 12 to 1 5 to 6 1 Non-mandatory Tour Jimmy’s House 2 Joint Tours 8 to 11, 3 to 4 Zoo, Market Mandatory tours are scheduled Non-mandatory travel is generated Destinations for non-mandatory tours are selected Non-mandatory tours are scheduled
Drive to zoo; walk to market No stops Shared ride 2; Walk Drive; Drive; Drive Drive to work; drive to lunch Starbucks near home Transit to school; bike to Jimmy’s No stops Transit; Bicycle Shared ride 2; Walk Ride to zoo; walk to market No stops Mode choice for all tours Stop frequency; stop location; stop time Trip mode choice
Feedback • Through the entire model stream • Sampling and run-time • Scenario run: 15/25/50 ~24 hours • Conformity run: 15/25/50/100 ~36 hours • Hardware and Software • Cube & Cube Cluster • PB CT-RAMP • Four identical machines • Each with 8 processors, 48 GB of RAM
Technical features. • Data collection and management. • Time frame for model development. • Key questions.
Home interview survey • Year 2000, MTC, $1.5 million • Year 2011/12, with Caltrans, $1.5 million • On-board surveys • Individual operator data used for model dev. • Year 2010 ?, $750,000 so far • Goal is continuous survey program • Ridership information collected via universal fare media • Roadways • Caltrans PeMS • Struggle to get good arterial data • MTC traveler information (segment speeds)
Technical features. • Data collection and management. • Time frame for model development. • Key questions.
Plan • Issue RFP in 2005 • Consultant specifies the model structure • Consultant writes the software • MTC estimates the models (with consultant assistance) • MTC calibrates the models (with consultant assistance) • Complete estimation by ~2007 • Actual • Issue RFP in 2005 • Consultant specifies the model structure • Consultant writes the software • Coefficients are borrowed and estimated by consultant • Consultant calibrates the models (with MTC’s guidance) • Model ready for use December 2010
Technical features. • Data collection and management. • Time frame for model development. • Key questions.
Development • Importance of model estimation • Software, software, software • Overseeing calibration • What is your agency good at, what is the consultant team good at • Application • High-occupancy toll lanes • Land development patterns on walking, transit • Cordon pricing • Roadway operation strategies • Greenhouse gas emissions • Telecommuting • Parking pricing • Diverse transit modes
What do you see as the benefits of having an activity-based model (ABM)? • The ease of communicating the model structure – behavioral realism • Directly answer “can you” questions – particularly those related to equity • Summarizing the results – endless possibilities
Was the value added by the ABM worth the cost? • Yes. The value of easily describing the model structure alone is worth the cost (e.g. never again defining a “home-based work” trip to glassy-eyed on-lookers). • The platform facilities extensions/further innovations.
What do you see as the drawbacks of having an ABM? • Theoretically complex • Technically complex • Computationally complex • Explicit answers to lots and lots of questions
How does the model work compared to your expectations? • The PB software is far more stable than I anticipated (crashes are very rare). • Analyzing the data is far more interesting and rewarding than I anticipated. • The behavioral realism and consistency is greater than I expected.
What would you change if you could? • More resources (computers, consulting budget, staff) • Sponsor multiple grants to software developers with guiding standards • More detail – smaller zones, richer roadway details, finer temporal resolution, etc…
In your opinion, what was the most difficult part of the model development? • Being brave and patient during model calibration • Dealing with sparse and limited data
If you were starting again from scratch, what would you do differently? • Collaborate with multiple MPOs – working with ARC was terrific • Let the consultants do what they do well • Try and improve upon what we do well
Knowing what you know now, would you again choose to develop an ABM? • Yes. There is no (real) debate as to whether the ABM approach is superior to the trip-based approach. The question is whether the costs are commiserate with the benefits.
Have you used your ABM to support LRTP development? • Currently using the model to support our 2013 RTP – through 2 of 3 rounds of alternatives analysis. • The demands of the model are far greater because the model is far more capable.
How does your agency store and manage data? • Runs require about 40 GB of data, depending on the sample size. • Runs are archived (about 1 GB of data) on a cloud server. Storage has not been an issue for us.
How do consultants run the model, how do you share results? • Too early to know • Currently share all files (execution and results), posted on a wiki managed by the modeling group • Working on a more formal data repository to share model results as well as GIS data
How does data management differ between trip-based models and ABM? • Challenges with distributing files to knowledgeable users are the same • Working with researchers is far easier as the results are far easier to understand
What innovations, if any, do you recommend regarding data collection and management? • Outward facing database of results
Day 2 Image source: flickr.com/shapiro125
Annual investment in modeling. • Team structure, roles, and responsibilities. • What works well and what could benefit from modifications/improvements.
Annual investment in modeling. • Team structure, roles, and responsibilities. • What works well and what could benefit from modifications/improvements.
Full time travel modeling staff • One principal, four associates • ABAG: one principal, one associate • MTC helps fund ABAG efforts as well as significant county modeling efforts • Development support • ~$150,000 annually (varies) • Consultants do majority of the work • Application support • ~$50,000 for RTP support • MTC does the majority of the work • Data collection • ~$1.5 million every decade for home interview • ~$250,000 annually for on-board survey (goal)
Annual investment in modeling. • Team structure, roles, and responsibilities. • What works well and what could benefit from modifications/improvements.
Principal • Reports to Planning Section Director • Manages development and application activities • Application lead • Oversees GIS activities • Associates • Highway network lead • Transit network lead • Data lead • Air quality lead • County modeling staff • Project-level work • ABAG • Land use development and application activities
Annual investment in modeling. • Team structure, roles, and responsibilities. • What works well and what could benefit from modifications /improvements.
The Good • Play to our strengths: management, writing, coding projects, attention to detail, over-arching technical approach • Information technology staff • Consultants • The Mixed • Software • County-level models • Staff development • The Not-so-good • Land use modeling housed in a separate agency
Questions Image source: flickr.com/Steve Punter