Download
1 / 45
460 likes | 803 Vues
LASER DIODE THERMAL DESORPTION IONIZATION SOURCE FOR MASS SPECTROMETRY. Patrice Tremblay, Ph.D. Motivations. Pharmaceutical, CRO, environmental and food industries need to improve productivity of high throughput screening and analysis. Actual techniques are often limited by :

E N D
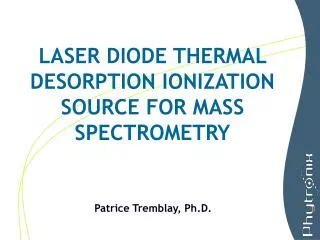
LASER DIODE THERMAL DESORPTION IONIZATION SOURCE FOR MASS SPECTROMETRY Patrice Tremblay, Ph.D.
Motivations • Pharmaceutical, CRO, environmental and food industries need to improve productivity of high throughput screening and analysis. • Actual techniques are often limited by : • Extensive samples preparation; • Risk of cross contamination between samples; • Background noise induced by mobile phase or enhancement matrix; • Analysis time. • In order to eliminate these problems, a new ionization source has been developed. • The LDTD technology (Laser Diode Thermal Desorption) coupled to a mass spectrometer offers the same analytical performances as any LC- MS/MS system and is an alternative to the problems encountered with usual techniques.
LDTD Ionization Source LazWell Sample Plate Carrier Gas Transfer Tube IR Laser Beam Mass Spectrometer Inlet Corona Discharge Needle Piston Piston head • Sample is dried onto the bottom of a well from a standard 96-well plate with a metal sheet insertion. • Thermal desorption induced by a laser at 980 nm (no photon-sample interactions). • Gaseous neutral species transferred by a carrier gas. • Ionization occurs into the corona discharge region.
Solvent (H2O)nH+ + H2O H3O+ H2O+ N2+ H2O (Solvent+H)+ transfers charge onto analyte (if possible) H2O N2+ N2 e- O2 N2+ e- e- N2 + N2 + + + + + + N4+ + e- Theoretical Aspects of the Ionization • The ionization process that occurs in the LDTD source is an Atmospheric pressure chemical (APC) type of ionization without the presence of solvent (no mobile phase or enhancement matrix.) LC APCI Corona discharge HV
(H2O)nH+ + Analyte H2O H3O+ H2O+ N2+ H2O H2O N2+ N2 e- O2 N2+ e- Analyte is forced to react with the cluster ion e- N2 + N2 + + + + + + N4+ + e- Theoretical Aspects of the Ionization • The ionization process that occurs in the LDTD source is an Atmospheric pressure chemical (APC) type of ionization without the presence of solvent (no mobile phase or enhancement matrix.) LDTD APCI Corona discharge HV
Key Features • Low volume sample analysis (1 to 10 µL) • 96-well plates are designed to be compatible with conventional sample preparation systems. • No extra sample pre-treatment needed • The absence of enhance matrix and mobile phase lower the noise signal. • Elimination of cross contamination due to LC. • Each well are individually isolated during the thermal desorption. • The thermal desorption process takes seconds
Key Features • Plug-and-play device Sciex Source Housing for API 3000, 4000 and 5000 Also available on Thermo, Waters and Agilent systems
Key Features • LazSoft and GLP environment : • Thermo mass spectrometers (Xcalibur) • LazSoft fully integrated into Xcalibur • Operated under GLP • Sciex mass spectrometers (Analyst) • Actually in discussion with Sciex to have access to the programmation code for LazSoft integration • Log Book created to trace the launch batch (LazSoft and Analyst)
Application – Drugs Analysis in Plasma Paracetamol Mifepristone Midazolam
LDTD Method and Plasma Sample Preparation (Paracetamol analysis) LDTD Parameters • Carrier gas flow : 3 L/min • APCI (+) • Laser Pattern • Increase laser power to 25 % in 1.0 s • Hold at 25 % for 0.5 sec. • Decrease laser power to 0 % MS Parameters • MS/MS transition : 152.0 – 110.1 amu 156.0 – 114.1 amu • Collision gas pressure : 1.5 mTorr (Ar) • Collision energy : 16 eV • Scan time : 0.050 s • Q1 width : 0.30 amu • Q3 width : 0.70 amu Sample Preparation (crashed plasma) • 100 µL of Human Plasma • Spike Paracetamol and Paracetamol-d4 (40 ng/mL) • 500 µL of acetonitrile (precipitation agent) • Vortex 4 min. • Centrifuge at 14000 RPM for 10 min. • Transfer Manually 4 µL onto LazWell to perform LDTD-MS/MS analysis M.W. 151.17 g/mol
High-Throughput LDTD-MS/MS Analysis of Paracetamol in Human Plasma 96-replicates Paracetamol raw signal ISTD signal Analyte Desorption in 1.8 seconds
Robustness and Repeatability (Paracetamol in Human Plasma) Area Ratio Run time of 75 minutes
Linearity (Paracetamol in Human Plasma) 0.6 to 5000 ng/mL
LDTD Method and Plasma Sample Preparation (Mifepristone analysis) LDTD Parameters • Carrier gas flow : 2 L/min • APCI (+) • Laser Pattern • Increase laser power to 60 % in 3 sec. • Hold at 60 % for 2 sec. • Decrease laser power to 0 % MS Parameters • MS/MS transition : 430.14 – 372.25 amu • Collision gas pressure : 1.5 mTorr (Ar) • Collision energy : 18 eV • Scan time : 0.02 sec. • Q1 width : 0.70 amu • Q3 width : 0.70 amu Sample Preparation (liquid-liquid extraction) • 50 µL of Mouse Heparin Plasma • Spiked Mifepristone (10 to 2000 ng/mL) • 20 µL IS(d4) + 50 µL NH4OH 4% • 2 mL of each MTBE and Hexane • Vortex 15 min. • Centrifuge at 2500 RMP for 10 min. • Evaporate organic phase to dryness at 40oC • Reconstitute in 200 µL of Water:ACN:Formic acid (75:25:0.1 v/v/v) • Transfer Manually 2 µL onto LazWell to perform LDTD-MS/MS analysis M.W. 429.59 g/mol
w = 1/x Area ratio Concentration (ng/mL) Calibration Curve (Mifepristone analysis) Calibration range : 10 to 2000 ng/mL Sample-to-sample run time 9 sec.
Back-Calculation and QC’s (Mifepristone analysis) • Standard concentrations back-calculated from calibration curve • QC’s performance
LDTD Method and Plasma Sample Preparation (Midazolam) LDTD Parameters • Carrier gas flow : 2 L/min • APCI (+) • Laser Pattern • Increase laser power to 40 % in 2 sec. • Hold at 40 % for 2 sec. • Decrease laser power to 0 % MS Parameters • MS/MS transition : 430.14 – 372.25 amu • Collision gas pressure : 1.5 mTorr (Ar) • Collision energy : 18 eV • Scan time : 0.02 sec. • Q1 width : 0.70 amu • Q3 width : 0.70 amu Sample Preparation (liquid-liquid extraction) • 100 µL of Human Plasma • Spiked Midazolam (0.5 to 250 ng/mL) • 10 µL IS(d4) + 50 µL NH4OH 4% • 3 mL of MTBE and 1 mL of Hexane • Vortex 15 min. • Centrifuge at 2500 RMP for 10 min. • Evaporate organic phase to dryness at 40oC • Reconstitute in 500 µL of Water:ACN:Formic acid (75:25:0.1 v/v/v) • Transfer Manually 2 µL onto LazWell to perform LDTD-MS/MS analysis M.W. 325.78 g/mol
Calibration Curve (Midazolam analysis) Calibration range : 0.5 to 250 ng/mL Sample-to-sample run time 8 sec. Concentration (ng/mL)
Back-Calculation, QC’s and Unknown (Midazolam analysis) • Standard concentration back-calculated from calibration curve • QC’s performance • Unknown : LDTD-MS/MS vs LC-MS/MS * Calculated as LC-MS/MS provides the true values * Calculated as if LC-MS/MS provides the true values…
Application – Drugs Analysis in Dried Blood Spot Paracetamol
LDTD Method and Blood Spot Sample Preparation (Paracetamol analysis) LDTD Parameters • Carrier gas flow : 2 L/min • APCI (+) • Laser Pattern • Increase laser power to 25 % in 2.0 sec. • Hold at 25 % for 2 sec. • Decrease laser power to 0 % MS Parameters • MS/MS transition : 152.0 – 110.15 amu • Collision gas pressure : 1.5 mTorr (Ar) • Collision energy : 16 eV • Scan time : 0.02 s • Q1 width : 0.70 amu • Q3 width : 0.70 amu Sample Preparation • Dried blood spot (with Paracetamol) • Punch out a 3 mm disc • 100 µL 50/50 Meoh/H2O + 250 ng/mL IS(D4) • Vortex for 20 sec. • Allow to stand for 30 min. • Centrifuge at 14000 RPM for 1 min • Transfer Manually 2 µL onto LazWell to perform LDTD-MS/MS analysis M.W. 151.17 g/mol
Calibration Curve : Paracetamol in blood Calibration range : 3.6 to 909 ng/mL 4 replicates CV lower then 4.6 % Sample-to-sample run time 8 sec. Concentration (ng/mL)
LDTD-MS/MS Signal Limit of detection : 2.6 ng/mL (3-times the blank value) Blank 3.6 ng/mL 909 ng/mL
Application – Sulfonamide Residues in Dairy Milk Analysis How to obtain specificity without LC
Sulfonamides Isomers and related structures • APCI(+), isomers show the same MRM transitions • APCI (-), specific MRM transitions • Specificity achieve by : • Right APCI mode • MRM mode
TIC Sulfadoxine 309 251 Sulfadimethoxine 309 131 LDTD-MS/MS Specificity • No chromatographic separation to analyze 16 compounds in 10 seconds • Specificity achieve using MRM in (-)APCI • Isomer analysis without chromatographic separation • 2 extracted samples with Sulfadoxine or Sulfadimethoxine (isomers) • TIC signal and extract signal for 2 MS/MS transitions • Excellent specificity
LDTD Method and Dairy Milk Sample Preparation LDTD Parameters • Carrier gas flow : 2 L/min • APCI (-) • Laser Pattern • Increase laser power to 25 % in 2 sec. • Hold at 25 % for 3 sec. • Decrease laser power to 0 % MS Parameters • Collision gas pressure : 1.5 mTorr (Ar) • Scan time : 0.02 sec. • Q1 width : 0.70 amu • Q3 width : 0.70 amu • MS/MS transition and Collision energy : Sample Preparation • 100 µL of Whole dairy milk • Spiked 16 sulfonamides (2 ng/mL to 1000 ng/mL) • Add Indapamide as internal standard • 500 µL of acetonitrile (precipitation agent) • Vortex 4 min. • Centrifuge at 14000 RPM for 10 min. • Filtrate supernatant on Nanosep 0.2 µm • Transfer 2 µL onto LazWell to perform LDTD-MS/MS analysis
Analytical Performance • Excellent linearity for all sulfonamides (> 0.99) • Extraction recovery from 85 % to 100 % • LOD of 2 ng/mL (4 pg loaded into well) from blank analysis 1000 ng/mL Blank
Application – Phase I and Phase II Metabolite Back Conversion Evaluation
Back-Conversion • LDTD-MS/MS does not have any chromatographic separation • All sample constituent may thermally desorbed, ionized and be introduced into the MS • Phase I and Phase II metabolites may back-convert (thermally or in the APCI region) into the corresponding drugs which may affect the quantification • Experiment • Sample containing high metabolite quantities • LDTD setup at the drug operating conditions • Monitoring the MS/MS transition of the drug and the metabolite • Evaluation of the back-conversion of the metabolite
OH-Midazolam Back-Conversion MS/MS Midazolam signal 326.04 – 291.04 amu Observed back-conversion of 0.2 % MS/MS OH-Midazolam signal 2.5 µg/mL solution 340.0 – 305.0 amu
Testosterone and Testosterone Glucuronide • From Peng et al. Clinical Chemistry, 46:4, 515-522 (2000) • Testosterone glucuronide in healthy Caucasian subject lower then 5 nM • Testosterone oral dose of 120-mg • 1 hour after administration blood Testosterone glucuronide increase at 310 nM • Experiment : • 100 µL Stripped Human EDTA Plasma • 500 µL Ethyl Acetate • Vortex agitation for 4 min. • Spiked supernatant with Testosterone (3 ng/mL) • Spiked supernatant with Testosterone glucuronide (200 ng/mL) • Analyze 2 µL in LDTD-MS/MS, following Testosterone transition (289.26 – 109.19 uma, 21 eV)
Testosterone and Testosterone Glucuronide • Results • Extract with Testosterone and no Testosterone glucuronide : 23254 count • Extract with Testosterone + Testosterone glucuronide : 27021 count • Back-conversion : 0.25 % • Real-life (Peng et al.) [5 nM of Testosterone glucuronide in blood] • Liquid-liquid extraction with organic hydrophobic solvent • Testosterone extracted in organic phase • Testosterone glucuronide stays in aqueous phase • 0.25 % of back-conversion will be negligible on the Testosterone signal (less then 0.01 ng/mL)
CYP3A4 inhibition study (Midazolam signal) • 3 Inhibition studies • 4 replicates • 2 µL directly spotted into well • Sample-to-sample run time of 10 seconds • No internal standard correction
CYP3A4 inhibition study (Midazolam signal) Area count Inhibition time
CYP3A4 inhibition study (OH-Midazolam signal) • No internal standard correction • CV lower then 15 %
CYP3A4 : OH-Midazolam (with ISTD) Signal ratio (Analyte/ISTD) Sample number
CYP2D6 : OH-Bufurolol (with ISTD) Signal ratio (Analyte/ISTD) Sample number
CYP2C9 : OH-Diclofenac (with ISTD) Signal ratio (Analyte/ISTD) Sample number
Pooled-CYP and CYP-Cocktail Samples LDTD allows to analyzed Pooled-CYP and CYP-cocktail samples Run-time of 9 seconds per samples List of CYP studies available until now :
CONCLUSIONS • Thermal desorption in induced indirectly by laser diode. • No photon-sample interactions • There is no need for an enhancement matrix. • There is no liquid mobile phase. • Ionization is produced by corona discharge. • Sample-to-sample run time as low as 4.5 seconds.
CONCLUSIONS • Picogram sensitivity can be achieved using 2-5 μL of sample. • No carryover or memory effect is observed during the process of 960 samples batch (and more). • Excellent linearity and accuracy achieve with the LDTD-MS/MS system. • Comparable performance to LC-MS/MS with higher throughput.