Download
1 / 41
410 likes | 589 Vues
V13 Control of Gene Expression. A bacterial cell lives in direct contact with its environment. Its chemical composition may dramatically change from one moment to the other. Consider bacteria growing either on lactose or tryptophan. Fig. 2.16 Lactose: di-saccharide from glucose + galactose

E N D
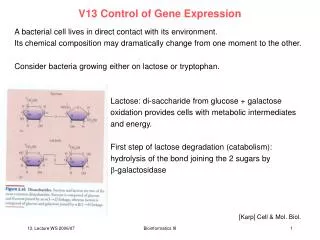
V13 Control of Gene Expression A bacterial cell lives in direct contact with its environment. Its chemical composition may dramatically change from one moment to the other. Consider bacteria growing either on lactose or tryptophan. Fig. 2.16 Lactose: di-saccharide from glucose + galactose oxidation provides cells with metabolic intermediates and energy. First step of lactose degradation (catabolism): hydrolysis of the bond joining the 2 sugars by -galactosidase [Karp] Cell & Mol. Biol. Bioinformatics III
Transfer from minimal medium to lactose medium When bacterial cells are grown in a minimal medium, they don‘t need -galactosidase and contains < 5 copies and only 1 copy of its mRNA. What happens when the cells are transferred to a lactose medium? [Karp] Cell & Mol. Biol. Bioinformatics III
lac Operon: an inducible operon Inducible operon: presence of substance (lactose) induces transcription of the structural genes. lac operon contains 3 tandem structural genes: z gene: encodes -galactosidase y gene: encodes galactoside permease, a protein that promotes entry of lactose into the cell a gene: encodes thiogalactoside acetyltransferase [Karp] Cell & Mol. Biol. Bioinformatics III
positive control by cyclic AMP Repressors, such as those of the lac and trp operons, exert their influence by negative control. lac operon is also under positive control, the „glucose effect“. If bacterial cells are supplied with glucose (as well as with other substances such as lactose or galactose), the cells catabolize the glucose and ignore the other compounds. glucose in the medium suppresses the production of various catabolic enzymes, such as -galactosidase, needed to degrade the other substrates. In 1965, cAMP was deteced in E.coli. The higher the glucose concentration, the lower the cAMP concentration. When adding cAMP to the medium in the presence of glucose, the catabolic enzymes that were normally absent were suddenly synthesized by the cell. cAMP binds to CRP. The cAMP-CRP complex recognizes and binds to a specific site in the lac control region. The presence of bound CRP changes the DNA conformation and allows RNA polymerase to transcribe the lac operon. [Karp] Cell & Mol. Biol. Bioinformatics III
positive control by cyclic AMP Fig. 12.27 [Karp] Cell & Mol. Biol. Bioinformatics III
Growth on Trp medium Trp is required for protein synthesis. If no Trp is available in the medium, the bacterium must expend energy synthesizing this amino acid cells contain enzymes and corresponding mRNA of Trp-synthesis pathway. If Trp becomes available in the medium, the cells no longer have to synthesize their own Trp. Within a few minutes, the production of the enzymes of the Trp pathway stops. In the presence of Trp, the genes encoding these enzymes are repressed. [Karp] Cell & Mol. Biol. Bioinformatics III
trp operon In a repressible operon, the repressor is unable to bind to the operator DNA itself. [Karp] Cell & Mol. Biol. Bioinformatics III
eukaryotic gene expression: PEPCK model case: gene that codes for phosphoenolpyruvate carboxykinase (PEPCK). This enzyme is one of the key enzymes of gluconeogenesis, the metabolic pathway that converts pyruvate to glucose. The enzyme is synthesized in the liver when glucose levels are low, e.g. when considerable time has passed since your last meal. Synthesis drops sharply after carbohydrate-rich meal. Level of synthesis of PEPCK mRNA is controlled by a variety of transcription factors, including several hormone receptors that are involved in regulating carbohydrate metabolism. To understand the regulation of PEPCK gene expression, we need to (1) unravel the functions of the numerous DNA regulatory sequences that residue upstream from the gene itself (2) identify the transcription factors that bind these sequences, and (3) identify the signalling pathways that activate the machinery responsible for selective gene expression. [Karp] Cell & Mol. Biol. Bioinformatics III
eukaryotic gene expression: PEPCK Fig. 12.32 TATA box followed by core promoter: site of assembly of a pre-initiation complex consisting of RNA polymerase II and a number of general TFs CAAT + GC boxes: bind global TFs such as NF1 and SP1; both are typically located 100 – 150 bp upstream proximal promoter elements [Karp] Cell & Mol. Biol. Bioinformatics III
Responsive elements from PEPCK gene various hormones affect the expression of PEPCK gene: insulin, thyroid hormone, glucagon, glucocorticoid. All of the act by means of specific TFs that bind to the DNA. Fig. shows responsive elements. [Karp] Cell & Mol. Biol. Bioinformatics III
Activation of transcription For example, let us focus on glucocorticoids, a group of steriod hormones (e.g. cortisol) that are synthesized in response to stress. Fig. 12.34 [Karp] Cell & Mol. Biol. Bioinformatics III
Conservation of regulatory elements? Nature 423, 241 (2003) Bioinformatics III
Comparative genome analysis Compare sequences of Saccharomyces paradoxus, S. mikatae, S. bayanus, with S. cerevisae. The three new yeast species have sufficient sequence similarity to S. cerevisiae to allow orthologous regions to be aligned reliably, but sufficient sequence divergence to allow many functional elements to be recognized by their greater degree of conservation by a four-way species comparison. Assemble with Arachne program Align 4 genomes. Nature 423, 241 (2003) Bioinformatics III
Conservation of the Gal4-binding site We first studied the binding site for one of the best-studied transcription factors, Gal4, whose sequence motif is CGGn(11)CCG (which contains 11 unspecified bases). Gal4 regulates genes involved in galactose metabolism, including the GAL1 and GAL10 genes, which are divergently transcribed from a common intergenic region (Fig. 6). The Gal4 motif occurs three times in this intergenic region, and all three instances show perfect conservation across the four species. In addition, there is a fourth experimentally validated binding site for Gal4 that differs from the consensus by one nucleotide in S. cerevisiae. This variant site is also perfectly preserved across the species. Nature 423, 241 (2003) Bioinformatics III
Conservation of the Gal4-binding site We then examined the frequency and conservation of Gal4-binding sites across the aligned genomes. In S. cerevisiae, the Gal4 motif occurs 96 times in intergenic regions and 415 times in genic (protein-coding) regions. The motif displays certain marked conservation properties: (1) occurrences of the Gal4 motif in intergenic regions have a conservation rate (proportion conserved across all four species) that is about fivefold higher than for equivalent random motifs. (2) intergenic occurrences of the Gal4 motif are more frequently conserved than genic occurrences. By contrast, random motifs are less frequently conserved in intergenic regions than in genic regions, reflecting the lower overall level of conservation in intergenic regions. Thus, the relative conservation rate in intergenic compared with genic regions is about 11-fold higher for Gal4 than for random motifs. (3) the Gal4 motif shows a higher conservation rate in divergent compared with convergent intergenic regions (those that lie upstream compared with downstream of both flanking genes); no such preferences are seen for control motifs. These three observations suggest various ways to discover motifs based on their conservation properties. Nature 423, 241 (2003) Bioinformatics III
Assign function Assign candidate functions to these discovered motifs by the genes adjacent to conserved occurrences of the motif with known gene categories. Test for Gal4 motif. Given the biological role of Gal4, we considered the set of genes annotated to be involved in carbohydrate metabolism (126 genes according to the Gene Ontology classification) with the set of genes that have a Gal4-binding motif upstream. The intergenic regions adjacent to carbohydrate metabolism genes comprise only 2% of all intergenic regions, but 7% of the occurrences of the Gal4 motif in S. cerevisiae and 29% of the conserved occurrences across the four species. suggests that a function of the Gal4 motif could be inferred from the function of the genes adjacent to its conserved occurrences. Such putative functional assignments can be useful in directing experimentation for understanding the precise function of a motif. Such considerations indicate that it should be possible to use comparative analysis, such as explored here for yeast, to identify directly many functional elements in the human genome that are common to mammals. More generally, comparative analysis offers a powerful and precise initial tool for interpreting genomes. Nature 423, 241 (2003) Bioinformatics III
Hybrid-methods for macromolecular complexes Structural Bioinformatics (a) Integration of structures of various protein components into one large complex. What to do if density is too small or too large? Sali et al. Nature 422, 216 (2003) Bioinformatics III
Example of EM/X-ray hybrid docking of atomic X-ray structure of tubulin (3.5 Å resolution) into 8Å-EM-structure of microtubuli. Sali et al. Nature 422, 216 (2003) Bioinformatics III
Overview: Various Techniques • Linear correlation of densities • Density filtering (Laplace correlation) • Core weighting of densities • Surface overlap matching (SOM) of densities • Electron tomography: detect particle densities in whole cells Wriggers, Chacon, Structure 9, 779 (2001) Bioinformatics III
Situs: Automatic fitting package X-ray / EM Situs was developed for automatic fitting of high-resolution X-ray structures into low-resolution EM maps. http://biomachina.org see also database for animations of the slow dynamics of low-resolution proteins:http://emotion.biomachina.org/ Willy Wriggers Chacon et al. Acta Cryst D 59, 1371 (2003) Bioinformatics III
Fourier Series The Fourier series is named after Joseph Fourier A Fourier series is a representation of a periodic function with period 2 as a sum of periodic functions of the form Joseph Fourier (1768 – 1830) which are the harmonics of eix. Euler‘s formula states It follows that Using cos (-x) = cos x and sin (-x) = - sin x www.wikipedia.org Bioinformatics III
Proof of Euler’s formula Define the complex number z such that Now we need to show that C must be zero. Set x = 0. Differentiating z with respect to x But z is just equal to Using the fact that i2= -1 Separating variables and integrating both sides: Now we exponentiate: where C is the integration constant. Bioinformatics III
Definition of a Fourier Series Suppose that f(x), a complex-valued function of a real variable, is periodic with period 2, and is square-integrable over the interval from 0 to 2. Let Each Fn is called a Fourier coefficient. Then, the Fourier series representation of f(x) is given by Using Euler‘s formula one can also express f(x) as an infinite linear combination of cos and sin functions: Bioinformatics III
Fourier transform Fourier transforms are generalizations of Fourier series. Most often, the term „Fourier transform“ refers to the continuous Fourier transform, representing any square-integrable function f(t) as a sum of complex exponentials with angular frequencies and complex amplitudes F(): Wriggers, Chacon, Structure 9, 779 (2001) Bioinformatics III
Fourier Transform Combine a sine function with frequency of 2, one with frequency of 3, and one with frequency of 5, The amplitudes and phases are suitably chosen so that the sum of the three sine functions (red) gives a nice match to the original signal. The lowest panel shows the Fourier Transform of the original signal. It consists of a series of peaks. The largest peaks are at 2, 3 and 5 on the x-axis. These correspond exactly to the sine-wave frequencies which we used to reconstruct the unit cell. The heights of the peaks correspond to the amplitudes of the three waves: The smaller peaks in the Fourier transform correspond to additional smaller waves which would have to be added to get a perfect fit to the original density. The Fourier Transform tells us what mixture of sine-waves is required to make up any function. Bioinformatics III
Convolution theorem If h(t) is the cyclic convolution of f(t) and g(t): where g(t) = g(t + 2n), then the Fourier series transforms are related by: Conversely, if Hn = 2 FnGn, then h(t) will be the cyclic convolution of f(t) and g(t). In the discrete space, if Hnis the discrete convolution of Fnand Gn: then the inverse transforms are related by: Conversely, if h(t) = f(t)g(t), then Hnwill be the discrete convolute of Fnand Gn. Wriggers, Chacon, Structure 9, 779 (2001) Bioinformatics III
Convolution theorem Computing the product of two functions f g is simple - the values of the two functions are simply multiplied at every point f(x) g(x). The convolution of two functions is more complex. To convolute two functions, the first function must be superimposed on the second at every possible position, and multiplied by the value of the second function at that point. The convolution is the sum of all of these superpositions. Wriggers, Chacon, Structure 9, 779 (2001) Bioinformatics III
The Convolution Theorem For example, here is a line, and its Fourier transform: The line can be convoluted with a circle: The result is a circle spread by moving it along the line, or alternatively a line spread by moving it around the circle. It is clear that the Fourier transform of the convolution is equal to the product of the transforms of the functions themselves. Wriggers, Chacon, Structure 9, 779 (2001) Bioinformatics III
Docking approaches for Multiresolution Structures I Fourier space refinement. Femand Fcalcare the Fourier coefficients (structure factors) of the EM map and the probe molecule. h: coordinates in Fourier space. R,T: rotational and translational parameters of the model. Aim: modify structure/orientation of probe molecule to optimize match of Femand Fcalc. Structure factor rj represents the position of a general atom in the unit cell relative to a lattice point; G corresponds to a specific Miller plane. Wriggers, Chacon, Structure 9, 779 (2001) Bioinformatics III
Direct space vector quantization II • Direct space refinement is WYSIWYG method. • it is e.g. straightforward to combine EM-based • refinement with constraints from biochemistry • or molecular force fields. • Advantage: very fast! • Disadvantage: all density must be accounted for. See following example how these limitations can be (partly) overcome. Wriggers, Chacon, Structure 9, 779 (2001) Bioinformatics III
Direct Space Flexible Fitting with Skeletons • Flexible refinement of T. aquaticus crystal • structure of RNA polymerase (RNAP) against E.coli EM data. • original EM reconstruction. RNAP and lipid are arranged in tubular crystals. • single RNAP strand extracted. Docking of single RNAP (white) into the density using Laplacian correlation coefficient Fit not optimal! • Discrepancy mapping = resulting map of fitted molecule was subtracted from map (b). • Segmentation of foreign densities (pink and yellow). • Single-molecule skeleton after subtracting foreign densities from (b) • Parametrization of skeleton. Connectivities and vector distances are based on a vector quantization. • Flexible fitting of RNAP. • Comparison of flexibly fitted model with single-molecule map of (e). Wriggers, Chacon, Structure 9, 779 (2001) Bioinformatics III
additional slides (not used) Bioinformatics III
Bragg Law Bombard a crystal being studied with photons, electrons or neutrons with an associated wavelength comparable to the interatomic spacing. A single atom (theoretically) scatters the incident waves equally in all directions, but in a crystal cancellation due to destructive interference gives zero in most directions. In certain directions constructive interference gives maxima of intensity, producing a pattern characteristic of the crystal structure. For constructive interference, the path difference between waves reflected from the 2 planes must be an integer number of the wavelength . As can be seen in the figure, the path difference is 2d sin and so the Bragg law is n = 2d sin www.chemsoc.org/exemplarchem/entries/2003/bristol_cook/diffraction.htm Bioinformatics III
Miller Indices Miller indices are the standard method for labelling the planes of atoms in a crystal. First, the directions of the lattice vectors a, b and c are identified as the lattice axes. The units of a, b and c are the number of lattice points. For example, the first lattice point lying on the a axis has a value for a of 1. Having identified the plane of atoms of interest, the points of intersection of this plane with the lattice axes are located. The reciprocals of these values are taken to obtain the Miller indices. The planes are then written in the form (h k l) where h = 1/a, k = 1/b and l = 1/c. Thus the (1 1 1) plane intercepts all three axes at 1. The (1 0 0) plane intercepts the a axis at 1 but never intercepts the b and c axes; the (1 0 0) plane is perpendicular to the a axis and lies parallel to the b-c plane. The (1 1 1) plane of a ccp lattice using the conventional lattice axes www.chemsoc.org/exemplarchem/entries/2003/bristol_cook/diffraction.htm Bioinformatics III
Reciprocal lattice Although the Bragg law gives a simple and convenient method for calculating the separation of crystallographic planes, further analysis is necessary to calculate the intensity of scattering from a spatial distribution of electrons within each cell. Fourier analysis of the periodic nature of crystal lattices shows the importance of a set of vectors, G, related to the lattice vectors a, b, and c. The set of vectors G is called the „reciprocal lattice“. This makes the calculation of the intensities and positions of peaks much easier. If a, b, and c are primitive lattice vectors of the crystal lattice, then a*, b*, and c* are primitive lattice vectors of the reciprocal lattice. www.chemsoc.org/exemplarchem/entries/2003/bristol_cook/diffraction.htm Bioinformatics III
Reciprocal lattice The reciprocal lattice vectors have the properties The reciprocal lattice is defined as where h, k, and l are arbitrary integers. www.chemsoc.org/exemplarchem/entries/2003/bristol_cook/diffraction.htm Bioinformatics III
Reciprocal lattice As an example of a reciprocal lattice, consider a simple cubic lattice with lattice parameter a. The most sensible choice of primitive lattice vectors is then: a = aib = ajc = ak The reciprocal lattice vectors are then: a* = 2/a i b* = 2/a j c* = 2/a k These lattice vectors correspond to another simple cubic lattice with lattice parameters 2/a. www.chemsoc.org/exemplarchem/entries/2003/bristol_cook/diffraction.htm Bioinformatics III
Reciprocal lattice It is no coincidence that the Miller indices identified earlier used the letters h, k and l. A diffraction pattern represents a map of the reciprocal lattice and this must be converted back into the crystal lattice. Diffraction involving the general (h k l) plane in the crystal lattice corresponds to the point in the reciprocal lattice with the coefficients h, k and l; this reciprocal lattice vector is perpendicular to the associated (h k l) plane. Recall that the real lattice vectors R can be represented as ua + vb + wc and the reciprocal lattice vectors G can be represented as ha* + kb* + lc*. It follows from the properties above that R · G = 2m (4) where m is an integer, because h, k, l, u, v and w are all integers. Further analysis reveals that www.chemsoc.org/exemplarchem/entries/2003/bristol_cook/diffraction.htm Bioinformatics III
Laue condition Laue formulated an alternative theorem to the Bragg law for diffraction. This theorem is beneficial because it does not require the assumptions used by Bragg, that reflection is specular and involves parallel planes of atoms. The derivation is based upon an incident wavevector k being absorbed and re-emitted as an outgoing wavevector k'. The scattering is assumed to be elastic, i.e. |k| = |k‘|. Laue's theory, based upon complex exponential phase factors, states that, for diffraction, the difference in the 2 wavevectors must be equal to a reciprocal lattice vector. That is: k' - k = G This condition is superior to the Bragg law because it rests only upon the assumption that scattering is elastic. The 2 conditions are, however, equivalent. http://www.chemsoc.org/exemplarchem/entries/2003/bristol_cook/lauecondition.htm Bioinformatics III
Structure factor Following Fourier analysis it is found that the scattering amplitude is the sum of complex exponentials. For a crystal of N cells the amplitude of a Bragg peak is proportional to the 'structure factor'. The intensity of a Bragg peak is then proportional to S*S = |S|2. In this expression, the dot product is taken for a specific value of G corresponding to a specific Miller plane. The vector rj represents the position of a general atom in the unit cell relative to a lattice point. The sum is hence taken over all atoms in the unit cell. f is the 'atomic form factor', a constant dependent on the atom at position rj. It is necessary because different atoms scatter containing different numbers of electrons incident radiation by different amounts. http://www.chemsoc.org/exemplarchem/entries/2003/bristol_cook/lauecondition.htm Bioinformatics III