Download
1 / 38
470 likes | 1.37k Vues
Microbiology of Water. William C. Morris Department of Food Science &Technology. Some Water Factoids. Number of people plagued by water shortage: 0.5X10 9 Average gallons used by average American per year: 183 gal. Estimated number of people who will be short of water by 2025: 2.8X10 9 .

E N D
Microbiology of Water William C. Morris Department of Food Science &Technology
Some Water Factoids • Number of people plagued by water shortage: 0.5X10⁹ • Average gallons used by average American per year: 183 gal. • Estimated number of people who will be short of water by 2025: 2.8X10⁹
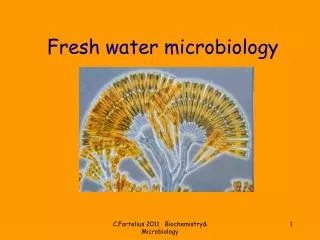
The Essentialness of Water Water covers 70% of the world • Blood in our veins approximates composition of sea water • Concept of hydrophilic and hydrophobic nature of biological molecules • These molecules determine shape of biological molecules and thus decide the specificity of all living processes Essential for All living organisms 97% of the water is in the oceans
We are a burgeoning human population unable to move away from its waste asparagus irrigation
All Microbes Live in an Aqueous Environment • Ecology of aquatic environments is complex • Most aquatic environments are teaming with life • Microbes have evolved to live in: • Saturated salt solutions • Below freezing to >110°C • Waters full of toxic substance , i.e. copper, cyanide, lead, silver, gasoline, oil, benzene, and many others
Water Quality in TN (2004)* • Sources of Agricultural Pollution in Assessed Streams and Rivers • Grazing related 60 % • Crop related 37 % • Intensive Animal Ops. 3 % * TN 305 (b) Report 2004
Terminology • Potable-(clean) water – free of all objectionable material, including pathogens, tastes, odors, colors, toxins, radioactive material, organisms, oils, gases, etc. • Fresh– non-salt or sea water • Pollution – anything that makes it Non-Potable • Sewage – the community waste or garbage that mother nature and we dump onto sewers or land
Typical Water Quality Standards • Drinking Water • No coliforms contamination acceptable • Recreational water • 200 fecal coliforms /100 ml • Fish and wildlife habitat • 5000 fecal coliforms/100 ml • Shellfish • 14 fecal coliforms/100 ml
Most Probable Number • 10 ml, 1 ml and 0.1ml of water inoculated in lactose broth • Coliforms identified by gas production • Refer to tables and determine statistical range of number of coliforms Does not: Detect total number of bacteria Specific pathogens
Knox County Tennessee • Environmental Health Department • They come to the farm and take the sample (use 100 ml) • Test for total coliforms and E. coli • Only report negative or positive results ( quite doing counts ~12 years ago) • $40.00 fee
Pathogens of Most Concern on Fresh Produce • Salmonella Shigella • Escherichia coli Campylobacter • Yersinia entercolitica Staphylococcus aureus • Clostridium species Bacillus cereus • Vibrio species • Viruses (Hepatitis A, Norwalk) • Parasites/Protozoa- (Giardia, Entamoeba, Toxoplasma, Sarccystis, Isopora,Cryptosporidium, Eimeria, Cyclospora) Vibrio species
Waterborne Infectious Disease(U.S. 1997-1998) DiseaseAgentOutbreaksCases Shigellosis Shigella sonnei 1 183 Giardiasis Giardia lambia 4 159 Cryptoporidiosis Cryptosporidium parvum 2 1432 Gastroenteritis E. Coli 0157:H7 3 164 Acute Unknown 5 163 gastrointestinal illness Shigella
Other Important Water Transmitted Organisms • Vibrio cholerae • Prevalent in U. S. in 1800’s • Currently common in Asia, Africa, Latin America • Over 100,000 deaths and 2345 deaths in 2004 • Transmitted through water, fresh vegetables and shellfish
Giardiasisand Cryptosporidiosis • Both are protozoans • Transmission through water (97% of all surface water carry cysts) • Resistant to chlorine, but can be filtered • 1993 Milwaukee outbreak (100,000)
Some Costly Cases • Cryptosporidium, 1993, Milwaukee, $55 million • Pfiesteria piscicida, 1997, Chesapeake bay, $43 million • 3700 beach closing in 1996 Mild case of diarrhea cost ~$280 for treatment and diagnosis
Life cycle of Cryptospoidium Transmission occurs mainly through Contaminated water.
Agricultural Water • Identify source and distribution of water used • Be aware of current and historical use of land • Review existing practices and conditions to identify potential sources of contamination. • Maintain wells in good working condition • How are you applying the water? Minimize contact of edible portion of fresh produce with contaminated irrigation water.
Water Quality Evaluation Log Irrigation Pesticide App. Hand Produce wash wash Water Source Y N Y N Y N Y N Open source, canal, Reservoir, pond, etc. Y N Y N Y N Y N Munciple water source Capped well, Annual test date Uncapped well, canal, reservoir, etc. Quarterly test date Municipal water source Quality report date
Public Health and Water Supply Routine monitoring of water quality using indicator organisms, indicating fecal contamination. To determine if fecal coliforms are from humans or other animals – must test for fecal streptococci
Fecal coliform/fecal streptococci ratios for humans and other animals Human 4.4 Duck 0.6 Sheep 0.4 Chicken 0.4 Pig 0.4 Cow 0.2 Turkey 0.1
Characteristics of a Useful Indicator • Useful for all water types • Always present when pathogens are present • Not present in the absence of the pathogen • Correlated with degree of pollution • More easily detectable than a pathogen • Survive longer than the pathogen • Not dangerous to work with
Bacterial-Indicator OrganismsCommon Groups • Coliforms • Total coliforms • Fecal coliforms • Escherichia coli • Streptococci • fecal streptococci • enterococci • Spore Formers • Clostridium perfringens
Indicator Organisms • General coliforms – indicate water in contact with plant or animal life (universally present) • Fecal coliforms – mammal or bird feces in water • Enterococcus bacteria(type of fecalstreptococci)– feces from warm blooded animals in water These are not what generally make people sick
Problems With the Coliform Indicator Test False Negatives False Positives Enterobacter areogenes Salmonella typhi
Some Factors Affecting Ratio of Indicator Organisms to Pathogens • Feces from human populations with higher infection rates are of greater concern • All treatment methods and environmental conditions affect pathogens and indicators differently -Chlorinated water may have zero indicators and pathogens, but loaded with viruses. - Pathogens can “hide” from treatment inside suspended solids. The ratio of indictors to actual pathogens is not fixed
Direct Tests For Pathogens • Involves selective cultivation to large numbers • Time consuming • Expensive • Potentially dangerous to lab personnel • Molecular tests • Require testing for each pathogen • Expensive • Require expertise
Viral Sources of Waterborne Disease • Hepatitis A: inflammation and necrosis of liver • Norwalk-type virus: acute gastroenteritis • Rotaviruses: acute gastroenteritis, especially in children • Enteroviruses: many types affect intestines and upper respiratory tract • Reoviruses: infects intestines and upper respiratory tract
Virus Detection Very difficult and costly • Electron microscopy • Immunoassays • Cell cultures • Reverse transcription-polymerase chain reaction (RT-PCR)
Chlorination of Water The most commonly used sanitizer!
Methods of Treatment • Shock Chlorination(50-100 ppm, contact of at least 6 hours) • Continuous Chlorination – for recurring bacterial contamination problems – a measurable amount of free residual chlorine
Chlorine Terms • Chlorine Dosage– total added • Chlorine Demand - inorganic • Combined Residual Chlorine - organic • Free Residual Chlorine
Chlorine Dosage Chlorine Demand Residual Chlorine
Chlorine Dosage Inorganic Chlorine Demand Kill Free Residual Chlorine Combined Residual Chlorine Organic
Free Residual Chlorine • Chlorine remaining after combining with organic matter • Bacteria kill rate proportional to concentration of free residual DPD, N,N-diethyl-p-phenylene-diamine
Bottom Line • Test your water as required and anytime you suspect a problem • Work with your County Environmental Health Department • Seek advise on interpreting the results – what do they mean? • If you question the results, resample and retest