Download
1 / 10
100 likes | 242 Vues
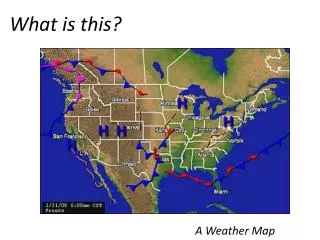
Weather maps are essential tools used to identify and locate weather phenomena such as fronts, high and low pressure areas, and temperature variations. They comprise isotherms, which connect places with the same temperature, and isobars, which link areas of equal air pressure. Surface maps use standard symbols to depict weather conditions, while forecast maps predict weather changes over 1-10 days. Both types of maps are vital for understanding current and future weather patterns, despite their inherent inaccuracies.

E N D
What is this? A Weather Map
Weather Maps: What do we use them for? • These maps are used to: • Locate and identify fronts • Areas of high and low pressure • Temperatures
Dissecting the Map • In a weather map, there are isotherms. These are lines that connect places with the same temperature. • To remember: isotherm has the word “therm” in it, like thermometer • There are also isobars. These are lines that connect areas of the same air pressure. • To remember: iosbar has the word “bar” in it and they have to do with pressure so think bench pressing.
Isobar When the bars are close together the wind is very strong, and when they are far apart the wind is gentler. Identify a spot where the wind is strong. Now where it is weaker. Do you see the difference in the two?
There are several types of weather maps. Surface Map Forecast Map What do you notice is different between the two maps?
Surface Maps • These maps use international symbols to represent wind speed, direction, temperature, types of clouds and amount of cloud cover • They also include information weather station reports
Forecast Maps • These are used to demonstrate the predicted changes in the weather. • These maps are created by computers • There are two types of forecast maps: • Short Range: indicate the weather for 18-36 hours • Constantly updated • Long Range: indicate weather for 6-10 days • Updated three times a week
Are Forecast maps 100% accurate? Why or Why not? No they are not. They are a prediction of what the weather should be. Think bad to news anchors, does it always rain when they say it should?