Analyzing Jury Selection Bias: The Castenda vs. Partida Case Study
This case study delves into the statistical analysis of jury selection bias, specifically in the Castenda vs. Partida case where the representation of Hispanic jurors was questioned. In a district where 79% of the population was Hispanic, only 39% of jurors selected were Hispanic. This discrepancy raises concerns about the jury selection process's fairness. Using proportions and z-scores, we analyze whether this difference is statistically significant and what it implies about bias in jury selection, applying the Castaneda Rule.

Analyzing Jury Selection Bias: The Castenda vs. Partida Case Study
E N D
Presentation Transcript
From samples to proportions… • Sometimes we work with actual samples from a population (heights, test scores, ages etc) • When this happens we use statistics of sample means • Our statistics range from 0 “n” • Sometimes, however, we work only with proportions of responses • Our statistics now range from 0 1
Legal Case Study… In the Castenda vs Partida case, the Texas jury selection process was challenged when it was alleged that jury selection was biased against Hispanics. In a population survey, 79% of the population in a district were of Hispanic descent but only 39% of the jurors selected were Hispanic. Is this “odd” from a statistical point of view?
Let’s assume that there were 1000 eligible jurors in this district; n = 1000 • We have two proportions: • p1 = 0.79 = proportion of Hispanics in district • p2 = 0.39 = proportion of Hispanics chosen for jury duty • Assumption: If the population is large we should expect our sample proportion to be normally distributed around the population mean. In this case 0.79 is known and is the population mean while 0.39 is a sample proportion (arrived at by the Texas jury selection process!). Are these two numbers statistically different?
And the z-score is … • There is no way this could happen by chance! The jury selection process is clearly biased. This is sometimes called the Castaneda Rule.
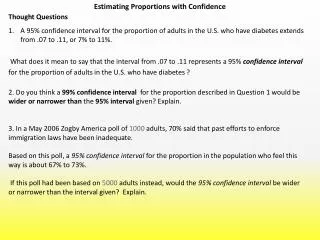
Jury selection with confidence… • If the jury selection process was not biased what proportion of Hispanic jurors should we expect to get 95% of the time in a population of 1000? Margin of error: A reasonable range would have been (0.77,0.81)