Download
1 / 15
160 likes | 197 Vues
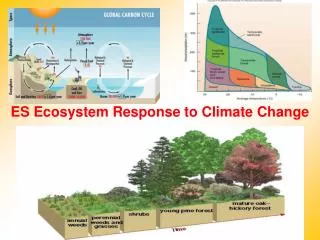
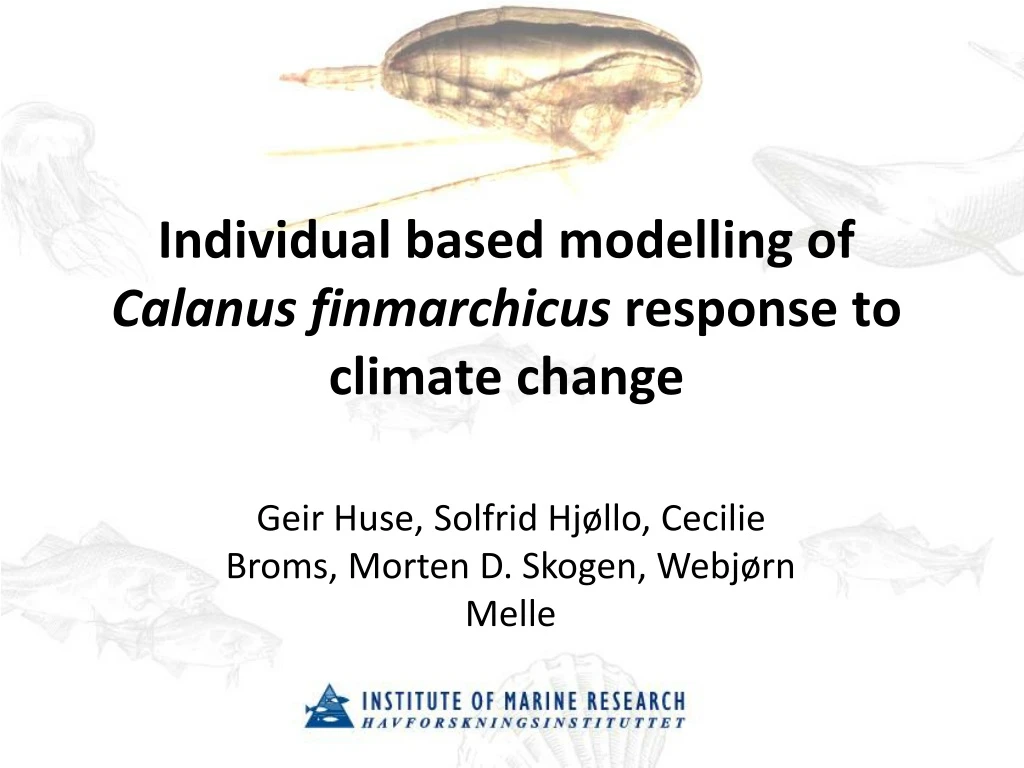
Explore C. finmarchicus behavior and adaptation to climate change in the Norwegian Sea using individual-based modeling. Study key ecological roles, population dynamics, and ecosystem interactions. The NORWECOM E2E model simulates individual traits impacting survival, reproduction, growth, and migration patterns. Results provide insights into the species' response to varying environmental conditions since 1981. The model incorporates elements like predation pressure, biomass production, and biogeochemical dynamics, with comparisons to observational data.

E N D
Individual based modelling of Calanus finmarchicus response to climate change Geir Huse, Solfrid Hjøllo, Cecilie Broms, Morten D. Skogen, Webjørn Melle
The Norwegian Sea is one of the core areas of C. finmarchicus • Key ecologicalrole as grazer and prey The Barents Sea • Importantsource for adjacent areas C. finmarchicus The Norwegian Sea The North Sea
INDIVIDUALS Behaviour Phen. Plast Life cycle Individualbasedmodelling POPULATION Abundance Survival Geography Genetics Biotic responses ECOSYSTEM Composition Trophic interactions Productivity
NORWECOM.E2E Trophic level • Two configurations: • Fully coupled • One-way coupling Minke whales 5 Harvesting Cod Haddock 4 Saithe Salmon Herring Mackerel Bluewhiting 3 3D S, T, v , u Ocean circulationfields (ROMS) Euphausiids Amfipods Acidification Calanus finmarchicus Calanus spp. 2 Small zooplankton 1 Diatoms Flagellates Pollution Biogeochemistry nomigration verticalmigration 3D migration
Super-individuals From http://pulse.unh.edu/ Attributes Strategies • Stage • Structural weight • Fat content • Position • Depth • Overwintering depth (OWD) • Wake up day (WUD) • Allocation to fat date (AFD) • Fat to soma ratio (FSR) • Vertical migration (VM1,VM2) Individuals
1981 1982 1983 1984 .. • The life of super-indviduals is simulated using traits to control actions at key points Model structure • Traits are inherited by offspring and adapted through selective growth and survival • Recombination and mutations add variability to traits
Feeding: functional response (Campbell 2001) • Growth: bioenergetics (Carlotti & Wolf 1998) • Mortality: predation, starvation, spawning • Reproduction: mature adults above size thres. • Vertical movement: ontogeny, dvm • Horizontal movement: Runge-Kutta • Fitness based resampling: Super individuals are resampled to a fixed initial population size at the start of the year to keep population size in check • Fitness: internal number*weight Processes
1 Random selection (1983) 2 Basic run (1983) 3 Interannual variability (1981-2004) 4 Low predator density (1983) 5 High predator density (1983) Four replicate runs per simulation Initial population size 500 super individuals Simulations
Random selection Basic run Results sim 1 & 2
Interannual var. (81-04) Basic run (1983) Reulsts sim 2 & 3
Low pred. dens. (1983) Basic run (1983) Results sim 2 & 4 Pred. dens. = 2 Pred. dens. = 1.6
High pred. dens. (1983) Basic run (1983) Results sim 2 & 5 Pred. dens. = 3.0
NORWECOM.E2E implementation Trophic level Minke whales 5 Harvesting Cod Haddock 4 Saithe Salmon Herring Mackerel Bluewhiting 3 3D S, T, v , u Ocean circulationmodel (ROMS) Euphausiids Amfipods Calanus finmarchicus Calanus spp. 2 Acidification Small zooplankton 1 Diatoms Flagellates Biogeochemistry Pollution 3D migration verticalmigration nomigration
Starting from initial state with realistic climate, background nutrient field and assumed Calanus mass & distribution and 50 000 super individuals • Annual mean biomass ~45 mill tonnes wet weight, mean production 190 mill tonnes wet weight, gives emergent PB-ratio = 4.3
About 350 observations of biomassandabundance Pointwise model-to-observations comparison - 1997