Download
1 / 12
120 likes | 224 Vues
Household Hazardous Waste Recycling In San Jose: Who Participates?. Hilary Nixon, Ph.D. San José State University. Project Motivation. HHW participants in San Jose (2002-2007) Some potential trends, but no statistical analysis Who recycles? Better use limited program resources

E N D
Household Hazardous Waste Recycling In San Jose: Who Participates? Hilary Nixon, Ph.D. San José State University
Project Motivation • HHW participants in San Jose (2002-2007) • Some potential trends, but no statistical analysis • Who recycles? • Better use limited program resources • Transferability/generalizability of analysis
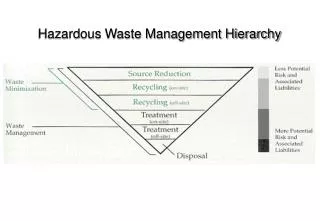
Methodological Motivation • Clarke & Maantay, 2006 • Explain low recycling rates in NYC • Suggest strategies for improvement
Data Details • 41,088 participants in San Jose (2002-2007), data from Santa Clara County • Final “usable” set = 32,917 • inaccurate addresses • multiple trips • located in census tracts with centroid within San Jose’s boundary • 181 census tracts
Density Analysis • Green, higher rates (850/sq. mi.) • Red, lower rates (~95/sq.mi) • Improved upon “dots” but additional analyses needed
Census Tract Participation Rate • Normalized by population (households) • Blue, above the mean • Red, below the mean
Census Tract Participation Rate Mean = 11% Std. Dev. = 8% Range = 0 to 32%
Regression: Who Recycles? n =181, R2 = 0.78
Opportunities & Limitations • Identify areas to focus limited HHW program resources • Design targeted programs • e.g. landlords/tenants of multifamily, outreach to different ethnic communities • BUT... • Demographic/socioeconomic characteristics only • Should consider environmental attitudes (costly) • Current analysis for only one HHW recycling model (appointment-based drop-off) • Examine impact of other models
Image References • http://www.in.gov/recycle/images/hhw.jpg • http://greshamoregon.gov/uploadedImages/Internet/City/City_Departments/Environmental_Services/Recycling_and_Solid_Waste_Division/Page_HHW.jpg • http://www.ccpa.net/images/pages/N2676/HHW2007.jpg • http://www.sccgov.org/portal/site/deh/agencychp/?path=%2Fv7%2FEnvironmental%20Health%2C%20Department%20of%20(DEP)%2FHazardous%20Materials%20Compliance%20Division%2FHousehold%20Hazardous%20Waste%20Home