Download
1 / 55
560 likes | 827 Vues
Thermodynamics and Kinetics in Biology. -Physical parameters in binding studies-principles, techniques and instrumentation -Methods to probe non-covalent macromolecular interaction (stopped-flow, BIAcore, and Microcalorimetry) Lecturer: Po-Huang Liang 梁博煌, Associate Research Fellow

E N D
Thermodynamics and Kinetics in Biology -Physical parameters in binding studies-principles, techniques and instrumentation -Methods to probe non-covalent macromolecular interaction (stopped-flow, BIAcore, and Microcalorimetry) Lecturer: Po-Huang Liang 梁博煌, Associate Research Fellow Institute of Biological Chemistry, Academia Sinica Tel: 27855696 ext. 6070
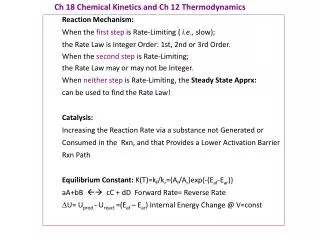
Transition state theory of enzyme Catalysis Activation energy profile of a reaction. (a) Activation energy (Go╪) , free energy change (Go) (b) A comparison of activation energy profiles for catalyzed and uncatalyzed reactions. For a reaction A + B P Rate = -DA/Dt = -DB/Dt = DP/Dt = k+[A][B] – k-[P] k = (kT/h) exp (-DG ╪ /RT) k=Boltzmann constant, h=Planck constant R: gas constant) Go = -RT lnKeq (Keq = [P]/[A][B]) Keq = k+ / k- (一個反應的平衡常數=正向反應 速率常數 / 逆向反應速率常數 )
Steady-state Enzyme Kinetics (simplified scheme) k1 k2 E + S ES E + P k-1 If [S] >> [E], d[ES]/dt = 0 Rate = k2[ES] d[ES]/dt =0 is called steady- state condition. d[ES]/dt = k1[E][S] – k-1[ES] + k2 [ES] = 0 k1[E][S] = k-1[ES] + k2 [ES] k1([E]T – [ES]) [S] = k-1[ES] + k2 [ES] ([E]T – [ES]) [S] / [ES] = (k-1 + k2) / k1 = KM [E]T [S] – [ES] [S] = KM [ES] [E]T [S] = [ES] (KM + [S]) [ES] = [E]T [S] / (KM + [S]) V = [ES] k2 Vmax = [E]Tk2 V = Vmax [S] / (KM + [S]) Michaelis-Menten equation when [S] = KM, V = ½ Vmax Km = (k-1 + k2) / k1 , when k-1 >> k2 (rapid equilibrium), KM = KES = k-1/ k1 In the case of k-1 is comparable to k2 (Briggs-Haldane kinetics), KM = KES + k2 / k1
Lineweaver-Burk double reciprocal plot Vmax / [E]T = turnover number = kcat kcat indicates catalytic efficiency (kcat is larger, reaction is faster) KM indicates substrate binding affinity (KM is smaller, binding is tighter)
Enzyme reaction is complicated 1. Calculation of net rate constant k1 k2 k3 k4 k5 A B C D E F k-1 k-2 k-3 k-4 The net rate constant for D -> E, k4’ = k4k5/(k-4 + k5) The net rate constant for C -> D, k3’ = k3k4’/(k-3 + k4’) …….etc P A F The partitioning of A to F vs. P =k1’/kP kP k1’ 2. Use of transit times instead of rate constant k1 k2 k3 k4 kn-1 EP1 EP2 EP3 EP4 ….. EPn The total time from P1 to Pn, 1/k, is given by the sum of the transit times for each step 1/k = 1/k1 + 1/k2 + 1/k3 + 1/k4 + …. + 1/kn-1 As an example E + A EA E + P The binding step is reduced to k1[A]k2 / (k-1 + k2) [E]o/V = 1/k = (k-1 + k2) / k1[A]k2 + 1/k2 1/V = (k-1 + k2) / k1[A]Vmax + 1/Vmax 1/V = KM / [A] Vmax + 1/Vmax
Pre-steady-state kinetics vs steady-state kinetics • The order of binding of substrates and release of product serves to define • the reactants present at the active site during catalysis: it does not establish • the kinetically preferred order of substrate addition and product release or • allow conclusions pertaining to the events occurring between substrate binding • and product release. • The value of kcat sets a lower limit on each of the first-order rate constants • governing the conversion of substrate to product following the initial collision • of substrate with enzyme. These include conformational changes in the enzyme- • Substrate complex, chemical reactions (including the formation and breakdown • of intermediates), and conformational changes that limit the rate of product release. • The value of kcat/KM defines the apparent second-order rate constant for • substrate binding and sets a lower limit on the second-order rate constant for • substrate binding. The term kcat/KM is less than the true rate constant by a factor • defined by the kinetic partitioning of the E-S to dissociate or go forward in the reaction. The goal of pre-steady-state kinetics to to establish the complete kinetic pathway Including substrate binding, chemical reaction (substrate through intermediates to product), and product release. k2 k3 k4 k1 E+ S ES EX EP E + P k-1 k-2 k-3 k-4
Fast kinetics • Product release step is slow so the steady-state rate = product release rate • To measure the rate of chemical step where the product release is much slower, a single-turnover condition needs to be employed. • Under single-turnover condition where [E] >[S], product release needs not to be considered. • Under multiple-turnover condition where [S] = 4 x [E], a burst kinetics (a fast phase followed by a steady-state phase of product formation) can be observed for a reaction with slower post-chemical step. • A special tool Quench-Flow, needs to be used for single-turnover experiment in msec time scale. • A Stopped-Flow instrument allows the measurements of • ligand interaction and chemical steps.
Rapid-Quench fast kinetics instrument Measure the real rate of chemical step (single turnover, [E]>[S]) Measure the product formation burst (multiple turnover, [S] = 4x[E])
UPPs (undeca-prenyl pyrophosphate synthase) reaction UPPs catalyzes sequential addition of eight IPP to an FPP molecule, forming an undeca-prenyl pyrophosphate with 55 carbons and newly formed cis double bonds.
UPPs synthesizes lipid carrier for bacterial cell wall assembly Dolichyl pyrophosphate synthase catalyzes the lipid carrier for Glycoprotein syntehsis
Enzyme single turnover rate is the same with or without triton 10 mM E, 1 mM FPP, 50 mM [14C]IPP (With triton) (Without triton) kcat is 0.013 s-1 in the absence of triton and 190-fold higher (2.5 s-1) in the presence of triton. However, the rate 2.5 s-1 under enzyme single turnover is the same with or without triton Pan et al., (2000) Biochemistry 10936-10942
UPPs single-turnover reaction time courses 10 mM UPPs, 1 mM FPP, 50 mM [14C]IPP Y axis represents the sum of [14C]IPP incorporated The data represent the time courses of C20 (●), C25 (○), C30 (■), C35 (□), C40 (◆), C45 (◊), C50 (▲), and C55 (△).
The rate constants for IPP condensation determined from single-turnover
UPPs multiple-turnover reaction 0.75 mM enzyme, 6 mM FPP and 50 mM [14C]IPP without Triton The data indicate formation of C55 (△), C60 (●), C 65 (■), C70 (◆) and C75 (▲)
Product dissociation is partially rate limiting and protein conformational change is rate determining
Substrate binding kinetics k1[S] Rate = d[E]/dt = -k1[S][E] d[E]/[E] = -k1[S]dt ln([E]t / [E]o) = -k1[S]t [E]t = [E]o exp (-k1[S]t) [ES] = [E]o-[E]t = [E]o(1-exp (-k1[S]t)) kobs = k1 [S] E ES k1[S] kobs = k1[S] + k-1 The slope of kobs vs [S] gives kon and intercept gives koff E ES k-1
Stopped-flow for measurements of protein-protein and protein-small molecule interaction
Substrate binding kinetics k1[S] Rate = d[E]/dt = -k1[S][E] d[E]/[E] = -k1[S]dt ln([E]t / [E]o) = -k1[S]t [E]t = [E]o exp (-k1[S]t) [ES] = [E]o-[E]t = [E]o(1-exp (-k1[S]t)) kobs = k1 [S] E ES k1[S] kobs = k1[S] + k-1 The slope of kobs vs [S] gives kon and intercept gives koff E ES k-1
FPP binding induces conformational change on a3 helix wild-type W31F has less quench W91F has almost no quench Chen et al., (2002) J. Biol. Chem. 7369-7376
Change of a3 from open to closed form makes L85, L88, and F89 close to bound FPP; W91 has altered fluorescence upon FPP binding
Synthesize FsPP to Probe UPPs Conformational Change FsPP Ki of FsPP as an inhibitor = 0.2 mM kcat of FsPP as an alternative substrate = 3 x 10⁻⁷ s-1 Chen et al.(2002) J. Biol. Chem. 277, 7369-7376
Conformational change and substrate binding Observed by Stopped-Flow UPPs-FPP + IPP UPPs-FsPP + IPP 3 phases in 10 sec 1 phase in 0.2 sec Binding rates vs. [IPP] gives IPP kon = 2 mM-1 s-1 2 phases in 0.2 sec
Fluorescent probe for ligand interaction and inhibitor binding using stopped-flow Chen et al., (2002) J. Am. Chem. Soc. 124, 15217-15224
Characterization of the fluorescent probe (A) (B) (A) Fluorescence is quenched by UPPs and recovered by replacement with FPP (B) Probe binds to UPPs with 1:1 stoichiometry (C) (D) (C ) Probe binds to UPPs with a kon = 75 mM-1 s-1 (D) Probe releases from UPPs (chased by FPP) with a koff = 31 s-1
Substrate and product release rate FPP is released at 30 s-1 UPP is released at 0.5 s-1 Can this method apply to drug-targeted prenyltransferases to find non-competitive inhibitor?
Sensor chip and coupling CM5: couple ligand covalently NTA: bind His-tagged lignad SA: capture biotinylated biomolecules HPA: anchor membrane bound ligand
Objects of the experiments • Yes/No binding, ligand fishing • Kinetic rate analysis ka, kd • Equilibrium analysis, KA, KD • Concentration analysis, active concentration, • solution equilibrium, inhibition Control of flow rate (ml/min) and immobilized level (RU) for different experiments
Definition ka A + B AB kd • Association rate constant: ka (M-1 s-1) • ---Range: 103 to 107 • ---called kon, k1 • Dissociation rate constant: kd (s-1) • ---Range: 10-5 to 10-2 • ---called koff, k-1 • Equilibrium constant: KA (M-1), KD (M) • ---KA = ka/kd = [AB]/[A][B] • ---KD = kd/ka = [A][B]/[AB] • ---range: pm to uM
Association and dissociation rate constant measurements ka A + B AB kd In solution at any time t : [A]t = [A]o – [AB]; [B]t = [B]o – [AB] d[AB]/dt = ka[A]t[B]t – kd[AB]t In BIAcore at any time t: [A]t = C; [AB] = R; [B]o = Rmax thus [B]t = Rmax – R d[R]/dt = ka*C*(Rmax-Rt) – kd (R)
It is easy to mis-interpret the data It Distinguish between fast binding and bulk effect: use reference or double reference Two ways to overcome mass transfer limitation: 1.increase flow rate 2. reduce ligand density
Example 2: Lackmann et al., (1996) Purification of a ligand for the EPH-like receptor using a biosensor-based affinity detection approach. PNAS 93, 2523 (ligand fishing) • Phenyl-Sepharose • Q-Sepharose HEK affinity column
Ion-exchange RP-HPLC
The ligand is Al-1, which is previous found as ligand for EPH-like RTK family
BIAcore analysis of bovine Insulin-like Growth Factor (IGF)-binding protein-2 Identifies major IGF binding site determination in both the N- and C-terminal domains J. Biol. Chem. (2001) 276, 27120-27128. IGFBPs contain Cys-rich N- and C-terminal and a linker domains. The truncated bIGFBP-2 were generated and their interaction with IGF were studied.
Lane 2: 1-279 IGFBP-2His Lane 3: 1-132 IGFBP-2 Lane 4: 1-185 IGFBP-2 Lane 5: 96-279 IGFBP-2His Lane 6: 136-279 IGFBP-2His
MicroCalorimetry System Right: ITC (Isotheromal titration Calorimetry) Inject “ligand” into “macromolecule” A small constant power is applied to the reference To make DT1 (Ts – Tr) negative. A cell feed-back (CFB) supplies power on a heater on the sample cell to drives the DT1 back to zero.
Binding isotherms Simulated isotherms for different c values c = K (binding constant) x macromolecule concentration c should be between 1 and 1000 Make 10-20 injections can be used to obtain binding affinity or binding equilibrium constant (Keq), molecular ration or binding stoichiometry (n), And heat or enthalpy (DH).
Activation of Ras following binding of a hormone (e.g. EGF) to an RTK GRB2 binds to a specific phosphotyrosine on the activated RTK and to Sos, which in turn reacts with inactive Ras-GDP. The GEF activity of Sos then promotes the formation of the active Ras-GTP.
Example: O’Brien et al., Alternative modes of binding of proteins with tandem SH2 domains (2000) Protein Sci. 9, 570-579 • pY110/112 bisphosphopeptide • binds to ZAP70 showing a 1:1 complex • (B) Monophoshorylated pY740 binds • to p85 with two binding events • (C) Binding of pY740/751 peptide into • p85. The asymmetry of the isotherm • shows two distinct binding events • showing that an initial 2:1 complex of • protein to peptide is formed. As further • peptide is titrated, a 1:1 complex is • formed.
ITC data for the binding of peptides to ZAP70, p85, NiC, and isolated c-SH2 domain KB1 and KB2 correspond to the equilibrium binding constants for the first and the second binding events.
Conformational change of two SH2 binding with phosphorylated peptide (A) Primary sequence NiC (B) a. NiC; b.NiC + bisphosphorylated peptide (C ) a. N-terminal SH2 alone; b.N-terminal SH2 + pY751 peptide; c. C-terminal SH2; .d. C-terminal SH2 + pY751 peptide
Model for binding of bisphosphorylated peptide to the SH2 domain • For AZP70, SH2 protein:peptide = 1:1 • For p85 (or NiC), initial titration results in peptide: SH2 protein = 0.5:1, • adding more peptide to reach 1:1 complex.