Download

1 / 28
280 likes | 421 Vues
Goal Sharing Team Training Statistical Resource Leaders (2). Peter Ping Liu, Ph D, PE, CQE, OCP and CSIT Professor and Coordinator of Graduate Programs School of Technology Eastern Illinois University Charleston, IL 61920. Control Charts for Variables. Introduction.

E N D
Goal Sharing Team TrainingStatistical Resource Leaders (2) Peter Ping Liu, Ph D, PE, CQE, OCP and CSIT Professor and Coordinator of Graduate Programs School of Technology Eastern Illinois University Charleston, IL 61920
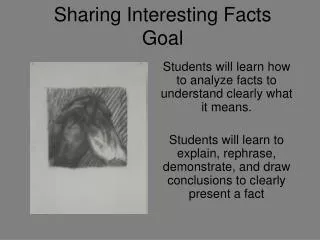
Introduction • Variable - a single quality characteristic that can be measured on a numerical scale. • When working with variables, we should monitor both the mean value of the characteristic and the variability associated with the characteristic.
Control Charts for and R Notation for variables control charts • n - size of the sample (sometimes called a subgroup) chosen at a point in time • m - number of samples selected • = average of the observations in the ith sample (where i = 1, 2, ..., m) • = grand average or “average of the averages (this value is used as the center line of the control chart)
Control Charts for and R Notation and values • Ri = range of the values in the ith sample Ri = xmax - xmin • = average range for all m samples • is the true process mean • is the true process standard deviation
Control Charts for and R Statistical Basis of the Charts • Assume the quality characteristic of interest is normally distributed with mean , and standard deviation, . • If x1, x2, …, xn is a sample of size n, then he average of this sample is • is normally distributed with mean, , and standard deviation,
Control Charts for and R Control Limits for the chart • A2 is found in Appendix VI for various values of n.
Control Charts for and R Control Limits for the R chart • D3 and D4 are found in Appendix VI for various values of n.
Control Charts for and R Trial Control Limits • The control limits obtained from equations (5-4) and (5-5) should be treated as trial control limits. • If this process is in control for the m samples collected, then the system was in control in the past. • If all points plot inside the control limits and no systematic behavior is identified, then the process was in control in the past, and the trial control limits are suitable for controlling current or future production.
Control Charts for and R Trial control limits and the out-of-control process • If points plot out of control, then the control limits must be revised. • Before revising, identify out of control points and look for assignable causes. • If assignable causes can be found, then discard the point(s) and recalculate the control limits. • If no assignable causes can be found then 1) either discard the point(s) as if an assignable cause had been found or 2) retain the point(s) considering the trial control limits as appropriate for current control.
Control Charts for and R Control Limits, Specification Limits, and Natural Tolerance Limits • Control limits are functions of the natural variability of the process • Natural tolerance limits represent the natural variability of the process (usually set at 3-sigma from the mean) • Specification limits are determined by developers/designers.
Control Charts for and R Control Limits, Specification Limits, and Natural Tolerance Limits • There is no mathematical relationship between control limits and specification limits. • Do not plot specification limits on the charts • Causes confusion between control and capability • If individual observations are plotted, then specification limits may be plotted on the chart.
Control Charts for and R Rational Subgroups • X bar chart monitors the between sample variability • R chart monitors the within sample variability.
Control Charts for and R Guidelines for the Design of the Control Chart • Specify sample size, control limit width, and frequency of sampling • if the main purpose of the x-bar chart is to detect moderate to large process shifts, then small sample sizes are sufficient (n = 4, 5, or 6) • if the main purpose of the x-bar chart is to detect small process shifts, larger sample sizes are needed (as much as 15 to 25)…which is often impractical…alternative types of control charts are available for this situation…see Chapter 8
Control Charts for and R Guidelines for the Design of the Control Chart • If increasing the sample size is not an option, then sensitizing procedures (such as warning limits) can be used to detect small shifts…but this can result in increased false alarms. • R chart is insensitive to shifts in process standard deviation.(the range method becomes less effective as the sample size increases) may want to use S or S2 chart.
Control Charts for and R Guidelines for the Design of the Control Chart Allocating Sampling Effort • Choose a larger sample size and sample less frequently? or, Choose a smaller sample size and sample more frequently? • The method to use will depend on the situation. In general, small frequent samples are more desirable.
Interpretation of and R Charts • Patterns of the plotted points will provide useful diagnostic information on the process, and this information can be used to make process modifications that reduce variability. • Cyclic Patterns • Mixture • Shift in process level • Trend • Stratification
Construction and Operation of and S Charts • If a standard is given the control limits for the S chart are: • B5, B6, and c4 are found in the Appendix for various values of n.
Construction and Operation of and S Charts No Standard Given • If is unknown, we can use an average sample standard deviation,
Construction and Operation of and S Charts Chart when Using S The upper and lower control limits for the chart are given as where A3 is found in the Appendix
Construction and Operation of and S Charts Estimating Process Standard Deviation • The process standard deviation, can be estimated by
The Shewhart Control Chart for Individual Measurements • What if you could not get a sample size greater than 1 (n =1)? Examples include • Automated inspection and measurement technology is used, and every unit manufactured is analyzed. • The production rate is very slow, and it is inconvenient to allow samples sizes of N > 1 to accumulate before analysis • Repeat measurements on the process differ only because of laboratory or analysis error, as in many chemical processes. • The X and MR charts are useful for samples of sizes n = 1.
The Shewhart Control Chart for Individual Measurements Moving Range Chart • The moving range (MR) is defined as the absolute difference between two successive observations: MRi = |xi - xi-1| which will indicate possible shifts or changes in the process from one observation to the next.
The Shewhart Control Chart for Individual Measurements X and Moving Range Charts • The X chart is the plot of the individual observations. The control limits are where
The Shewhart Control Chart for Individual Measurements X and Moving Range Charts • The control limits on the moving range chart are:
The Shewhart Control Chart for Individual Measurements Example A care unit in a hospital monitors patient falls. Some sample data are recorded as following: Month Fall Month Fall 1 15 6 3 2 15 7 1 3 13 8 10 4 9 9 13 5 9 10 7 …
The Shewhart Control Chart for Individual Measurements
The Shewhart Control Chart for Individual Measurements Interpretation of the Charts • X Charts can be interpreted similar to charts. MR charts cannot be interpreted the same as or R charts. • Since the MR chart plots data that are “correlated” with one another, then looking for patterns on the chart does not make sense. • MR chart cannot really supply useful information about process variability. • More emphasis should be placed on interpretation of the X chart.