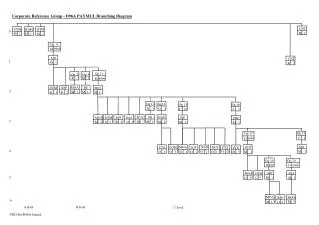
Investigating Interacting Coronal Mass Ejections in Heliospheric Space: Insights from Spacecraft Observations
This study explores the interaction of coronal mass ejections (CMEs) as observed by multiple spacecraft. Key events from May and August 2010 were analyzed, revealing distinct signatures of ICMEs at varying longitudinal separations. Our findings highlight the impact of approaching CMEs on plasma conditions and magnetic fields near Earth. We utilized data from instruments such as STEREO, Wind, and Venus Express to understand the dynamics of CMEs. This work contributes to further understanding of solar events and their propagation effects on space weather.

Investigating Interacting Coronal Mass Ejections in Heliospheric Space: Insights from Spacecraft Observations
E N D
Presentation Transcript
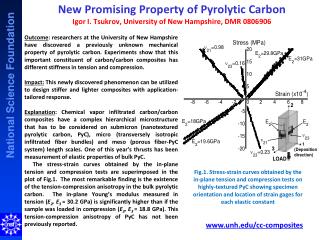
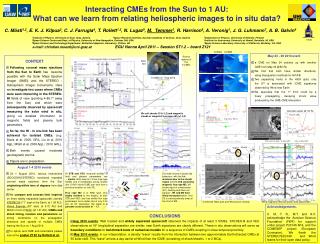
UNH M3 M2 S2 M3 M2 M2=M3? S2 M1(earlier eruption) M1 S2 Acknowledgements. C. M, T. R., M.T. and A.V. acknowledge the Austrian Science Foundation (FWF) for support under project P20145-N16, and the COMESEP project (European Comission). We thank the STEREO/SECCHI and Wind teams for their open data policy. • CONCLUSIONS • Aug 2010 events: Well located and widely separated spacecraft observed the impacts of at least 3 ICMEs. STEREO-B and VEX observations at 18° longitudinal separation are similar, near Earth signatures are clearly different. These in situ observations will serve as boundary conditions for benchmark tests of numerical models for a sequence of CMEs erupting in close temporal proximity. • May 2010 events: in our interpretation, a density “wave“ results from the interaction between two approximately Earth-directed CMEs at 50 solar radii. This “wave” arrives a day earlier at Wind than the ICME (consisting of shock/sheath+ 1 or 2 MCs). Interacting CMEs from the Sun to 1 AU: What can we learn from relating heliospheric images to in situ data? C. Möstl1,2, E. K. J. Kilpua3, C. J. Farrugia4, T. Rollett1,2, N. Lugaz5, M. Temmer1, R. Harrison6, A. Veronig1, J. G. Luhmann7, A. B. Galvin4 1Institute of Physics, University of Graz, Graz, Austria 2Space Research Institute, Austrian Academy of Science, Graz, Austria 3Department of Physics, University of Helsinki, Finland 4Space Science Center and Dept. of Physics, University of New Hampshire, Durham, NH, USA 5Institute for Astronomy, University of Hawaii, Honolulu, HI, USA 6Space Science and Technology Department, Rutherford Appleton Laboratory, Chilton, UK 7Space Science Laboratory, University of California, Berkeley, CA, USA e-mail: christian.moestl@uni-graz.atEGU Vienna April 2011 – Session ST1.2 – board Z121 Low T region, ICME?(earlier eruption, no shock) COR2A COR2B • May 23 - 29 2010 event • a CME on May 24 catches up with another CME from May 23 @50 Rs • We find that both have similar directions, using triangulation methods for HI1A/B • Two separating fronts in the HI2A Jplot, only the 2nd is associated with ICME signatures observed by Wind near Earth • We speculate that the 1st front could be a freely propagating, decaying shock wave produced by the CME-CME interaction. Source regions of the 5 CMEs 3 • CONTEXT • Following coronal mass ejections from the Sun to Earth has become possible with the Solar Mass Ejection Imager (SMEI) and the STEREO - Heliospheric Imager instruments. Here we investigate two cases where CMEs were seen interacting in the STEREO-HI fields of view (pointing 4-88.7° away from the Sun) and which were subsequently observed by spacecraft measuring the solar wind in situ, giving us detailed information on magnetic fields and plasma bulk parameters. • So far, the HI - in situ link has been achieved for isolated CMEs. (e.g. Davis et al. 2009, GRL; Liu et al. 2010 ApjL; Möstl et al. 2009 ApjL / 2010 GRL). • Both events caused moderate geomagnetic storms. • Papers are in preparation. • August 1-4 2010 events • On 1 August 2010, various instruments (SDO/SOHO/STEREO) monitored repeated coronal mass ejections from the Sun originating within tens of degrees from disk center. • We compare and contrast their imprints on three widely separated spacecraft, namely STEREO-B (71° east of the Earth, at 1.06 AU), Venus Express (53° east, at 0.72 AU) and Wind in front of Earth (at 1.01 AU). ICMEs and shock timing, location and parameters set strong constraints on the propagation directions and speeds of multiple CMEs leaving the Sun on 1 Aug 2010. • For Jplots and CME and kinematics please look at the poster Z122 byRollett et al. CME SDO AIA 5 2 1 4 May 23 CME 5 CMEs on 1 Aug 2010(approximate directions) In situ density peak (STEREO-B) May 24 CME Venus M1 M2 CME directions: short arrows-May 24 long arrows- May 23triangulation (Liu et al. )tangent-to-a-sphere (Lugaz et al.) May 23 CME LE May 24 CME LE Velocities adjust @~50 Rs We call shocks Si (i=1,2) and magnetic clouds or magnetic flux ropes Mi (i=1,2,3) Different fronts of the May 23 CME May 24 CME Same for May 24 CME S2 May 23 CME HI1A frame at the time the leading edge of May 24 CME runs into the back of the May 23 CME Small scale flux rope = 23 May CME? MC= 24 May CME? shock “wave“ MC sheath Earth “wave“ At STB and VEX, temporal profiles of field and plasma parameters are ~ similar. Both saw min. 3 flux-rope type ICMEs and 2 moderately strong shocks(but S1/M1 shock-ICME pair was from a previous eruption on July 30). Flux rope M2 is of WSE type, thus highly inclined to the ecliptic, at both STB and VEX, and has similar flux rope parameters, but a radial size of only 0.04 AU. At 18° separation this leads to a pancake cross-section of ~ 1:7. Dst index shows a double dip behaviour, with the 1st minimum due to the sheath region and the 2nd caused by magnetic flux rope M2. M1 shows signs of compression (D1), heating and does not expand – M1 and M2 have likely interacted before 1 AU. D2 is a strong density jump at the front of M2. front 1 2 „wave“ ~ 1day aheadof the ICME seen by Wind ICME sheath region observed later by Wind Combined HI2A Jplot and Wind proton density Wind magnetic field and proton bulk parameters