Download
1 / 73
730 likes | 842 Vues
THE CONTINUING CHALLENGES OF ONLINE SURVEYS. Pathways 2014 Conference Integrating Human Dimensions Into Fisheries and Wildlife Management Presented by Mark Damian Duda, Responsive Management. 75-80% purchase license over the counter. 20-25% purchase license online. 1.4% coverage rate.

E N D
THE CONTINUING CHALLENGES OF ONLINE SURVEYS Pathways 2014 Conference Integrating Human Dimensions Into Fisheries and Wildlife ManagementPresented by Mark Damian Duda, Responsive Management
75-80% purchase license over the counter 20-25% purchase license online
1.4% coverage rate Response Rate Among Those With Email Addresses 7%
METHODOLOGY • Conducted May-July 2013 • Sample consisted of license buyers from 2005 to 2012 from three avidity groups • Avid license buyers (those who bought a license in every year from 2005 to 2012) • Inconsistent license buyers (those who bought a license only 3 to 6 of the 8 years from 2005 to 2012) • One-time license buyers (those who bought a license only once from 2008 to 2012). • Landline and cellular telephone survey of 1,858 hunters and anglers
Measuring Participation: Comparison of Telephone and Online Panel Surveys (in millions of participants) Sources: U.S. Forest Service’s National Survey on Recreation and the Environment (telephone survey); Sports and Fitness Industry Association’s 2013 Sports, Fitness and Leisure Activities Topline Participation Report (panel survey)
Reach of Responsive Management 700 human dimensions projects Almost $60 million in research 50 states – 15 countries Every state fish and wildlife agency and most federal resource agencies; most DNRs and NGOs Initiated by WAFWA in 1985 Data collection for the nation’s topuniversities: Auburn University, Colorado State University,Duke University, George Mason University,Michigan State University, Mississippi StateUniversity, North Carolina State University,Oregon State University, Penn State University,Rutgers University, Stanford University, TexasTech, University of California-Davis, University of Florida, University of Montana,University of New Hampshire, University ofSouthern California, Virginia Tech, and WestVirginia University
METHODOLOGIES Qualitative Methodology • Public Meetings • Focus Groups Quantitative Methodology • Personal Interviews /Direct Observation • Telephone Surveys • Mail Surveys • Web-Based Surveys (where appropriate) • Mixed-Mode Surveys
Public Meetings • Examples: • 2012 Washington State Comprehensive Outdoor Recreation Plan • Virginia Department of Game and Inland Fisheries’ 2011-2020 Bear Management Plan • Attitudes Toward the Strategic Direction of the Arkansas Game and Fish Commission • Saltwater Recreational Fisheries Management Plan • Public Opinion on Management Options for Recreational Fishing of Early Run King Salmon on the Kenai and Kasilof Rivers
Focus Groups • Examples: • Focus Groups of Pennsylvania’s Lapsed Hunters • Understanding the Impact of Peer Influence on Youth Participation in Hunting and Target Shooting • Enhancing Fishing Access Through a National Assessment of Recreational Boating Access • Anchorage Residents’ Opinions on Bear and Moose Population Levels and Management Strategies
Personal Interviews /Direct Observation • Examples: • A Study of Ohio River Contact Recreational Use, Characteristics Of Contact Recreational Use, and Site-Specific Fish Consumption Rates • Public Attitudes Toward Illegal Feeding and the Harassment of Wild Dolphin in Florida • Lake Tahoe Boater Survey • Dockside Intercept Surveys for the National Oceanic and Atmospheric Administration / Catch Rates
Mail Surveys • Examples: • Public Opinion on Fishing and Hunting License Structures and Pricing in Minnesota • From Media to Motion: Improving the Return on Investment in State Fish and Wildlife Marketing Efforts • Indiana Hunter Survey
Telephone Surveys(Landline and Cellular Telephones) • Examples: • Idaho Residents’ and Sportsmen’s Opinions on Wildlife Management and the Idaho Department of Fish and Game • Understanding Public Attitudes Toward Human-Wildlife Conflict and Nuisance Wildlife Management in the Northeast United States • Hunters’ Attitudes Toward CWD and the Impact of Management Efforts in Maryland • Virginia Hunters’, Anglers’, and Boaters’ Opinions on and Satisfaction With the Department of Game and Inland Fisheries’ Law Enforcement Activities • Survey of New Jersey Freshwater Trout Anglers • Exploring Data Collection and Cost Options for the NationalSurvey of Fishing, Hunting, and Wildlife-Associated Recreation • Kansas Residents’ Awareness of and Attitudes TowardThreatened and Endangered Species • Kentucky Residents’ Awareness of and Opinions on Elk Restorationand Management Efforts • Virginia Residents’ Opinions on Black Bear and Black BearManagement • Pennsylvania Residents’ Opinions on Deer and DeerManagement • Florida Annual Statewide Deer Harvest Surveys
Web-Based Surveys • Examples: • American Fisheries Society Salary Survey • U.S. Fish and Wildlife Service Employee Morale Survey • Great Florida Birding and Wildlife Trail Satisfaction Survey • Washington SCORP Recreational Providers Surveys • Arkansas Game and Fish Commission Employee Morale Survey • Stakeholders’ Opinions on and Attitudes Toward the Longleaf Alliance and its Strategic Plan
Mixed-Mode Surveys • Examples: • Understanding Residents’ Opinions on Algae Levels and its Impact on Public Use of West Virginia Waters • The Impact of Various Images and Media Portrayals on Public Knowledge of and Attitudes Toward Chimpanzees • 2012 Washington State Comprehensive Outdoor Recreation Plan Outdoor • Surveying the Social Media Landscape: Identifying the Most Effective Social Media Delivery Methods to Increase Support for and Participation in Hunting and Shooting
Four Issues • Sample Validity • Non-Response Bias • Stakeholder Bias • Unverified Respondents
North Carolina Sunday Hunting Study • To assess North Carolina residents’ opinions on whether Sunday hunting should be allowed in the state • Online opinion poll (non-random sample, 10,000 responses) • Telephone survey (random sample, 1,212 responses, sampling error ±2.815 percentage points)
South Carolina Saltwater Fishing and Shellfishing Study • To assess participation in and opinions on saltwater fishing and shellfishing in South Carolina • Telephone survey of randomly chosen individuals from the license database (random sample, 1,709 responses) • Online survey of individuals from the license database who provided an email address when they purchased their licenses (non-random sample)
2012/2013 FLORIDA DEER HARVEST RATES Estimated Number of Deer Harvested: Telephone Survey = 142,325 Web Survey = 207,022 45.46% increase
Methodologies are a means to an end. One important issue is coverage.
RDD and Cell phone samples overlap, yield complete coverage of phone households RDD CELL ONLY 39.9% LANDLINE ONLY 7.1% CELL + LANDLINE 52.6% Slide courtesy of the University of Virginia. All percentages are from 2013 NHIS data. Cell phones
Address-Based Sampling (ABS) • ~95% coverage of U.S. residential households • Provides alternative way to sample cell phone-only households • More geographically precise sample selection Source: American Association for Public Opinion Research Cell Phone Task Force Report
Typology of Online Surveys Worst • Open-ended – placed on web, anyone can respond • Online panel – respondents sign up in exchange for cash or other incentives • Online panel – respondents contacted and invited to participate • Database with partial email addresses (e.g., most current databases of hunting and fishing licenses, boater registrations) • Database with full coverage (e.g., agency employee databases) • Web used as part of multi-modal survey Best
Comments from probability-based random sample online survey panelists: “I take about 50 online surveys a year.” “Takes way too long to make $5. The surveys are horridly long and boring and plain. When you do get the $5 check, it takes three weeks to reach you in the mail.” “I can't believe how many surveys I've taken with this company, and for a couple of months I've had trouble accessing my account. I figured my points must be quite high by now, and I was excited to see I have almost 4000 points. I was hugely disappointed to see that 4000 points = $4. Once I reach $5 I'm quitting, because it's a total waste of my time.” Source: SurveyPolice.com user reviews for the Global Opinion/Synovate panel, available at http://www.surveypolice.com/global-opinion-panels-synovate
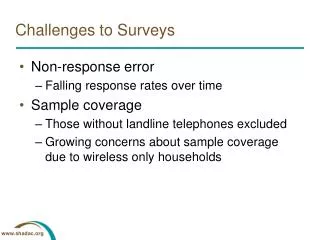
Sample validity: For a valid sample, every member of the population must have a known chance of participating. Without a valid sample, all data are questionable. Sample selection bias: The bias exists due to a flaw in the sample selection process, where a subset of the data is systematically excluded due to a particular attribute. Non-Response bias: People who do not respond have the potential to be different from those who do respond. People who do respond are more likely to be interested in the topic. Without a valid sample frame, the presence or absence of non-response bias cannot be determined.
Issues: • Response rate (response rate of a response rate?) • No amount of weighting makes up for a poor sample • Coverage • Are your trends really trends? • Can we really compare results? • Some attitudes are so prevalent that it doesn’t matter how poor the coverage is
A Multi-Modal Approach Total Population M E E Cell phones C C M C E L M L L Landlines E Emails C C L M E E M L M L L Every member of the population must have a known chance of participating. Mailing address C E M C M
Exploring Alternative Methods for Data Collection for the National Survey of Fishing, Hunting, and Wildlife-Associated Recreation Photo: VDGIF/Dwight Dyke Photo: USFWS/Steve Hillebrand Pathways 2014 Conference Integrating Human Dimensions Into Fisheries and Wildlife ManagementPresented by Mark Damian Duda, Responsive Management
These projects are being conducted under a grant from the U.S. Fish and Wildlife Service and administered by the Association of Fish and Wildlife Agencies.
TWO PROJECTS FUNDED • Project 1 (2013-2015): Exploring Data Collection and Cost Options for the National Survey of Fishing, Hunting, and Wildlife-Associated Recreation • Partners: ASA, ATA, and Responsive Management • Project Goals: Replicate the current methodology of the National Survey and evaluate cost options • Project 2 (2014): Planning and Coordination of the 2016 National Survey of Fishing, Hunting, and Wildlife-Associated Recreation • Partners: NSSF, ASA, ATA, and Responsive Management • Project Goals: Identify cost-effective sampling methodologies and alternative approaches for conducting the 2016 National Survey
PROJECT 1: EXPLORING DATA COLLECTION AND COST OPTIONS FOR THE NATIONAL SURVEY OF FISHING, HUNTING, AND WILDLIFE-ASSOCIATED RECREATION • 2-year pilot study • 2 test states • Compare results • Analyze costs
Study Objectives • Replicate National Survey data collection in two representative test states: North Carolina and South Dakota • Determine average costs for National Survey data collection in two test states and identify potential opportunities for budget reductions. • Assess comparability of the results of this pilot study with current results from the National Survey conducted by the USFWS and U.S. Census Bureau, to determine the feasibility of alternative data collection options. • Develop recommendations for AFWA’s National Grants Committee based on the assessment of costs and logistical requirements for implementing the National Survey.
Methodology YEAR 1: 2013-14 • Met with the U.S. Fish and Wildlife Service • Guidance regarding methodology • Copy of survey instrument • Code the survey for CATI administration • Selected test states: North Carolina and South Dakota • Identify Primary Sampling Units (PSUs) and develop sample YEAR 2: 2014-15 • Conduct surveys • Screener and categorization (hunters, anglers,wildlife watchers) • Wave 1 surveys: May / June 2014 • Wave 2 surveys: September 2014 • Wave 3 surveys: January 2015 • Analyze results and costs • Compare with 2011National Survey results • Prepare final report and recommendations
Sample Development • National Survey uses the U.S. Census Bureau’s Master Address File (not accessible). • Using Random Digit Dialing (RDD) and supplemental cell phone sample. • Coverage Rate: 97.7% of U.S. households have a phone (landline and/or cell). (National Center for Health Statistics, December 2013) • Response rates – will replicate National Survey calculation method for direct comparison (American Association for Public Opinion Research, RR2 formula)
Supplemental Cell Sample • Approximately 38% of all adults live in a household with only a cell/wireless phone.(National Center for Health Statistics, December 2013) • Responsive Management routinely supplements RDD with cell sample for general population studies. • Plan to supplement proportionately to the population living in cell-only households in each state. Sources: National Center for Health Statistics, December 2013; Survey Sampling International, January 2014.