Download
1 / 1
10 likes | 146 Vues
M. truncatula. Control. cDNA-AFLP analysis 6149 tags visualized. Group A: 299 nodulation regulated genes. CVnod ≥ 0.4. Control/(h)GSH-depleted variance test p <0.05. BSO treatment. (h)GSH-depleted. Inoculation with S. meliloti. Time course (0, 12, 24,…, 96h). Time course

E N D
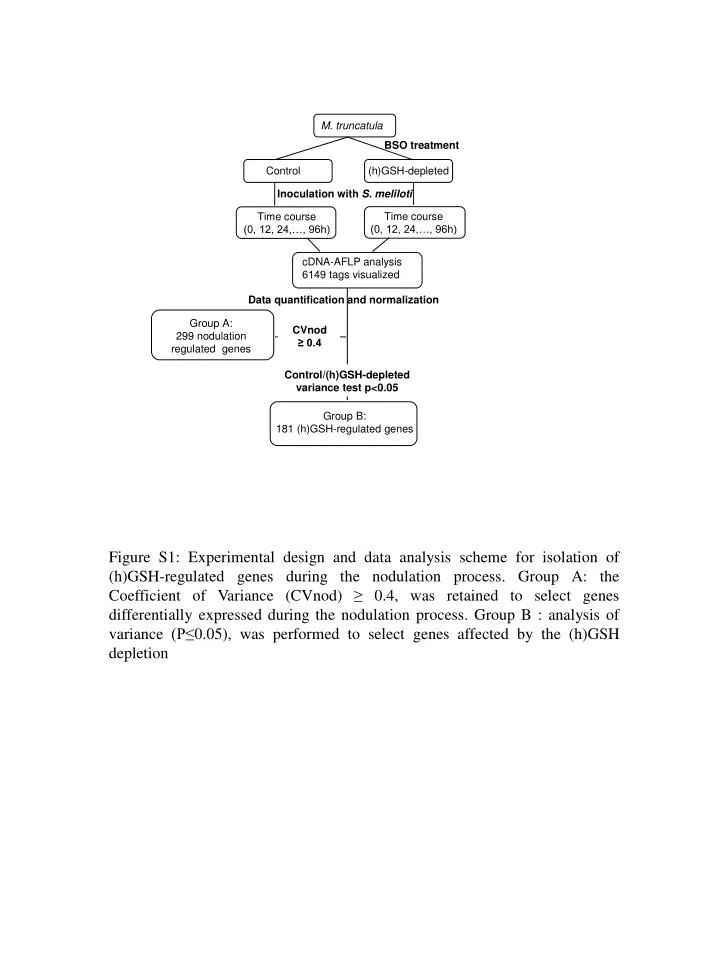
M. truncatula Control cDNA-AFLP analysis 6149 tags visualized Group A: 299 nodulation regulated genes CVnod ≥ 0.4 Control/(h)GSH-depleted variance test p<0.05 BSO treatment (h)GSH-depleted Inoculation with S. meliloti Time course (0, 12, 24,…, 96h) Time course (0, 12, 24,…, 96h) Data quantification and normalization Group B: 181 (h)GSH-regulated genes Figure S1: Experimental design and data analysis scheme for isolation of (h)GSH-regulated genes during the nodulation process. Group A: the Coefficient of Variance (CVnod) ≥ 0.4, was retained to select genes differentially expressed during the nodulation process. Group B : analysis of variance (P≤0.05), was performed to select genes affected by the (h)GSH depletion