Download
1 / 109
1.09k likes | 1.28k Vues
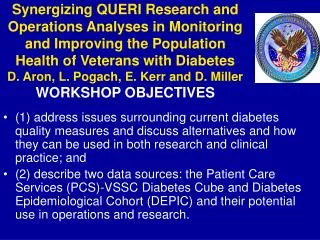
Synergizing QUERI Research and Operations Analyses in Monitoring and Improving the Population Health of Veterans with Diabetes D. Aron, L. Pogach, E. Kerr and D. Miller WORKSHOP OBJECTIVES.

E N D
Synergizing QUERI Research and Operations Analyses in Monitoring and Improving the Population Health of Veterans with DiabetesD. Aron, L. Pogach, E. Kerr and D. MillerWORKSHOP OBJECTIVES • (1) address issues surrounding current diabetes quality measures and discuss alternatives and how they can be used in both research and clinical practice; and • (2) describe two data sources: the Patient Care Services (PCS)-VSSC Diabetes Cube and Diabetes Epidemiological Cohort (DEPIC) and their potential use in operations and research.
Introduction and Context for Diabetes Quality Measurement David C. Aron, MD, MS Co-Clinical Coordinator, DM QUERI ACOS/Education, Louis Stokes Cleveland DVAMC Professor of Medicine Case Western Reserve University School of Medicine
QUERI WORKSHOP Agenda Context for performance measurement Limitations of measurement Alternative means for cross sectional measurement Cross sectional measures vs Longitudinal Measures Individuals versus populations Sources of Data
How Do We Use Performance Measurement Public Accountability (External) • External transparency • To compare healthcare plans or physicians based upon a metric • To financially reward plans and physicians Quality Improvement (Internal) • Internal to plan or practice • To guide population based improvement • Can be used for internal reimbursement
Specialty Societies, Big Pharma, Disease Group Advocacy Encourage Disease Management Offer better products Inform product design ↑Sustainability Quality Improved practice Formulary Management Drug Detailing Payers Seeking Value Provider inbroadsense-PDCA/QI Re-Assess Proftability ↑Market Share Evidence QI Measures and Reports Research Measures Identify Gaps LowerMedical loss ratio Reports Marketing Marketing Get Information Utilization(Micro-Choice) Utilization(Macro-Choice) InformedConsumer Choice MakeHealthcarechoices Chooseamongplayers Direct to Consumer Advertising NON-TRANSPARENT INFLUENCES ON MEASURES AND PUBLIC REPORTING OF QUALITY DATA Assess
Who are the patient?Age Distribution of VA Patients - 2005 WWII Korea War Vietnam War Post-Vietnam % 24% 40% 14% 23% 20 30 40 50 60 70 80 90 100 AGE Dramatic increase in proportion of younger patient recent years.
5-year Mortality Rates in Veterans with Diabetes <65 Years with Co-morbidities Pogach et al. AJMC March, 2007
Evolving Evidence Base:Studies of Glycemic Control and Its Relationship to CVD Outcomes
What populations do worse on glycemic control ? • Longer duration of diabetes African Americans and White Hispanic • <45 yrs worse than 45-54 than 55-64 • Mental Health Conditions: Psychoses, Substance Abuse and/or anxiety/PTSD disorders • Lower socioeconomic-educational status (buying healthy food, diabetes numeracy?) • Less social support
QUERI WORKSHOP 12-09 Context for performance measurement Limitations of measurement Alternative means for cross sectional measurement Cross sectional measures vs Longitudinal Measures Individuals versus populations Sources of Data
Technical Elements of Performance Measurement • Measurement uncertainty • Population at risk • Bias (differences in population) • Effectiveness in practice • Feasibility and cost of data collection • Baseline status, patient safety, patient preferences
Facility Variation in Factors Impacting Glycemic Control (1999-2000) Maney et al, Diabetes Care, 2007
FY08 Performance Measures A1c • A1c FACILITY VARIATION RANGE (730-2270, mean 1560 EPRP charts) • <7=46% [range 42-49 VISNS] • <8=72% [range 66-72 VISNS] • >9=16% [range 15-20 VISNS] • LDL-C • <120 mg/dl=81% • <100 mg/dl=68% • Based upon ~32K charts
Age is Important: Lifetime Risk for Blindness Due to Diabetic Retinopathy* Vijan, S. et. al. Ann Intern Med 1997;127:788-795
Lifetime Risks for End-Stage Renal Disease* Vijan, S. et. al. Ann Intern Med 1997;127:788-795
Benefits of Glycemic Risk Reduction (7.9% to 7.0%) over 10 yrs from the UKPDS (Budenholzer et al, BMJ 1245, 2001)
Benefits of Blood Pressure Reduction 154/87 to 144/82 over 8.5 yrs from the UKPDS
Cross Sectional “Good” Measure Options • Case mix adjustments: What is not under plan control? • Socio-positioning • Age • Duration, Type 1 or 2, others • Exclusions: • What to exclude? Life expectancy, health risk, side-effects • How To Score • Pass/Fail? “Partial” credit: • How to weight?
Curvilinear relationship between A1c and Microvascular Disease: Risk of retinopathy and by A1C level DCCT Research Group NEJM 1993
Stringent Dichotomous Outcome Measures • Don’t target patients most likely to benefit • Ignore the heterogeneity of patient risk factors • Don’t help providers do the “right” thing • Do not give “partial credit” for actions or improvements that may yield considerable benefits • Don’t take into account patient preferences • Could mandate care that is contrary to the wishes of a reasonable, well informed patient • Could result in unintended consequences • Polypharmacy, hypoglycemia, worse outcomes
QUERI WORKSHOP 12-09 Context for performance measurement Limitations of measurement Alternative means for cross sectional measurement Cross sectional measures vs Longitudinal Measures Individuals versus populations Sources of Data
Implementing Linked Clinical Action Measures for Assessment and Improvement Eve A. Kerr, MD, MPH PI, Ann Arbor VA Center for Clinical Management Research Research Coordinator, DM QUERI Associate Professor of Internal Medicine University of Michigan Health System
The Paradox of Performance Measurement "Not everything that can be counted counts, and not everything that counts can be counted." • Albert Einstein (1879-1955) From a sign hanging in Albert Einstein's office at Princeton. How can we measure what counts?
What Makes a Good Quality Measure?AHRQ/NIDDK/VA Scientific Conference on Diabetes Quality Assessment • Target patients most likely to benefit • Help providers do the “right” thing • Incorporate (or at least don’t ignore) patient preferences • Avoid unintended consequences • Acknowledge limitations of current data sources and resulting measures (and motivate collection and use of clinically detailed data) http://www.ahrq.gov/QUAL/diabetescare/
Measuring Quality in Diabetes Patients with diabetes who are 75 years or younger should have A1c < 7% BP < 130/80 Do stringent dichotomous outcomes measure what counts?
Do stringent dichotomous outcomes target patients most likely to benefit? Lifetime Risk of Blindness due to Retinopathy Vijan et al. Ann Int Med, 1997
Stringent Dichotomous Outcome Measures • Don’t target patients most likely to benefit • Ignore the heterogeneity of patient risk factors • Don’t help providers do the “right” thing • Do not give “partial credit” for actions or improvements that may yield considerable benefits • Don’t take into account patient preferences • Could mandate care that is contrary to the wishes of a reasonable, well informed patient • Could result in unintended consequences • Polypharmacy, hypoglycemia, worse outcomes
Tightly Linked Clinical Action Measures • Identify high risk populations by diagnosis or by a poor intermediate outcome or other assessment of high risk • Evaluate processes of care that are strongly associated with important outcomes for that population • Intrinsically identify appropriate quality improvement responses within the measure that are under a health system’s control - Kerr et al. Am J Manag Care 2001
Linked Clinical Action Measures:Adequate Quality for Hyperlipidemia Treatment • Tightly Linked Clinical Action Measure • LDL <130 mg/dl; or • LDL>= 130 mg/dl with appropriate clinical action: 1) were on a high dose statin; or 2) had statin started or dose increase within 6 months; or 3) repeat LDL <130 mg/dl within 6 months; or 4) had contraindications noted to statin treatment
Percentage with Adequate Quality Kerr et al. Medical Care 2003
Linked Clinical Action Measures • Target patients most likely to benefit by : • accounting for patients’ risk factors and benefits of intervention • Incorporating exceptions • Help providers do the “right” thing • Intrinsically incorporate quality improvement response • Can take into account patient preferences • Incorporate refusals or patient priorities • Diminish but don’t eliminate potential for unintended consequences Kerr et al. Am J Managed Care 2001
Measuring What Counts • Focus on high risk populations and high benefit interventions • Consider the costs, burden and safety of the treatments needed to achieve the goals • Give at least partial credit for processes under providers’ control • Insist on improvements in availability of clinically meaningful data • Guard against unintended consequences
“Everything should be made as simple as possible, but not one bit simpler.” • Albert Einstein (1879 - 1955)
ACCORD: More deaths in intensive vs standard glycemic control groups Do stringent dichotomous outcomes target patients most likely to benefit? National Heart, Lung, and Blood Institute. ACCORD telebriefing prepared remarks. February 6, 2008.
Sampled performancemeasures = SUBSET OF QUALITY (+ MORE NOISE) Universe of possible performance measures = OVERALL QUALITY (+ SOME NOISE) The Universe of Performance Measures
VA Compared to Community * * Asch et al. Annals of Internal Medicine, 2004 *P<0.01
Designing Clinically Meaningful Measures • Tightly-Linked Clinical Action Measures • Weighted or QALY-adjusted Measures
kerr Weighted MeasuresDavid Aron and Len Pogach • Differentially weighting measures in a composite can reflect the relative contributions of each measure to outcomes of interest • Outcomes of interest may be defined specifically: e.g., cardiovascular events, mortality, or QALYs • Certain measures can be weighted (or stratified) to reflect the importance of achieving the measure to different populations
ADA-NCQA Diabetes Physician Recognition “Weights and Measures” Scored Measures Threshold Weight (% of patients in sample) • HbA1c Control <7.0% 40%10.0 • HbA1c Poor Control >9.0 % 15% 15.0 • Blood Pressure Control >140/90 mm Hg 35% 15.0 • Blood Pressure Control <130/80 mm Hg 25% 10.0 • LDL Control >130 mg/dl 37% 10.0 • LDL Control <100 mg/dl 36% 10.0 • Eye Examination 60% 10.0 • Foot Examination 80% 5.0 • Nephropathy Assessment 80% 5.0 • Smoking Status and Cessation Advice or Rx 80% 10.0 Total Points = 100.0 Points to Achieve Recognition = 75.0
What Are Quality Adjusted Life Years? • Trade off between quality and length of life • QALY for a given intervention is the average number of years of life gained by the intervention, multiplied by a judgment of quality of life in those years, summed over a lifetime • Can address summary benefits and harms • Can address issues of life expectancy at time of intervention
QALY Model • Trade off between quality and length of life • QALYs are the most important and broadly used method for evaluating health quality. • Panel on Cost Effectiveness in Health and Medicine (Gold et al. 1996): Medical CE studies should incorporate morbidity and mortality consequences into a single measure using QALYs.
The Case for QALYs to Assess Quality • A1c reduction improves QOL by reducing complications, which differ in their impact upon QALYs • Prioritization of public health measures requires an assessment of the impact of an intervention (ARR) • The relationship of A1c to absolute reduction of complications is log-linear over a wide A1c range and is a function of life expectancy
Problems with QALYs • Numerous studies have demonstrated that the correlation between one’s current health and the time-tradeoff or standard gamble utility for that health state is at best modest. (Tsevat 2000) • Maximum endurable time: Subjects can tolerate no more than a particular time in an undesirable health state, beyond which each additional increment of time decreases overall utility. Miyamoto et al (1998) • Such behavior cannot be accommodated within the QALY model.
QALY model and Extrinsic Goals • In the QALY model, quality of health is given weight proportional to health duration; It follows that the QALY model cannot directly account for extrinsic goals, whose importance is by definition independent of duration • an author might want to complete a book; • many individuals seek to have children and raise families.
Additional Considerations (QALYs) • Equity considerations • interventions for young preferred to interventions for old • Young have more life years remaining • life extensions for healthy preferred to life extensions to less-healthy • Healthy have a higher quality than chronically ill
CE Ratios (Cost/QALY) CDC, JAMA 2002
Prop. Short Fall = 60% Prop. Short Fall = 50% QoL Prop. Short Fall = 50% QALY gain QALY lost Now t Prop. Short Fall = 25% Proportional short fall • Compares loss in QALY with expected QALY • The higher the proportion • The higher the need for equity compensation