TABLE OF CONTENTS
940 likes | 1.42k Vues
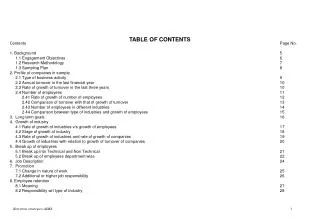
TABLE OF CONTENTS. Contents Page No. 1. Background 5 1.1 Engagement Objectives 6 1.2 Research Methodology 7 1.3 Sampling Plan 8 2. Profile of companies in sample 2.1 Type of business activity 9

TABLE OF CONTENTS
E N D
Presentation Transcript
TABLE OF CONTENTS Contents Page No. 1. Background 5 1.1 Engagement Objectives 6 1.2 Research Methodology 7 1.3 Sampling Plan 8 2. Profile of companies in sample 2.1 Type of business activity 9 2.2 Annual turnover in the last financial year 10 2.3 Rate of growth of turnover in the last three years 10 2.4 Number of employees 11 2.41 Rate of growth of number of employees 12 2.42 Comparison of turnover with that of growth of turnover 13 2.43 Number of employees in different industries 14 2.44 Comparison between type of industries and growth of employees 15 3. Long term goals 16 4. Growth of industry 4.1 Rate of growth of industries v/s growth of employees 17 4.2 Stage of growth of industry 18 4.3 Rate of growth of industries and rate of growth of companies 19 4.4 Growth of industries with relation to growth of turnover of companies 20 5. Break up of employees 5.1 Break up into Technical and Non Technical 21 5.2 Break up of employees department wise 22 6. Job Description 24 7. Promotion 7.1 Change in nature of work 25 7.2 Additional or higher job responsibility 26 8. Employee retention 8.1 Meaning 27 8.2 Responsibility wrt type of industry 28 Retention strategies-AIMA
TABLE OF CONTENTS Contents Page No. 1. Background 5 1.1 Engagement Objectives 6 1.2 Research Methodology 7 1.3 Sampling Plan 8 2. Profile of companies in sample 2.1 Type of business activity 9 2.2 Annual turnover in the last financial year 10 2.3 Rate of growth of turnover in the last three years 10 2.4 Number of employees 11 2.41 Rate of growth of number of employees 12 2.42 Comparison of turnover with that of growth of turnover 13 2.43 Number of employees in different industries 14 2.44 Comparison between type of industries and growth of employees 15 3. Long term goals 16 4. Growth of industry 4.1 Rate of growth of industries v/s growth of employees 17 4.2 Stage of growth of industry 18 4.3 Rate of growth of industries and rate of growth of companies 19 4.4 Growth of industries with relation to growth of turnover of companies 20 5. Break up of employees 5.1 Break up into Technical and Non Technical 21 5.2 Break up of employees department wise 22 6. Job Description 24 7. Promotion 7.1 Change in nature of work 25 7.2 Additional or higher job responsibility 26 8. Employee retention 8.1 Meaning 27 8.2 Responsibility wrt type of industry 28 Retention strategies-AIMA
An AIMA Study on Retention Presented By Business Today Retention strategies - AIMA
Contents Page No. 8.21 Responsibility wrt number of employees 29 8.22 Area of concern wrt turnover of the company 30 8.3 Problem of retention wrt type of industry 31 8.31 Problem of retention wrt number of employees 32 8.32 Problem of retention wrt turnover of companies 33 8.33 Problem of retention wrt growth rate of industries 34 8.34 Problem of retention wrt growth rate of turnover 35 9. Turnover rate 9.1 Turnover rates in the last three years 36 9.2 Department wise turnover rate Technical v/s Non technical 37 10. Induction Rate 10.1 Induction rates in the last three years 38 10.2 Department wise induction rate Technical v/s Non technical 39 11. Retention levels wrt turnover of companies 40 11.1 Retention level wrt. type of industry 41 11.2 Status of retention levels and the reasons 42 12. Attrition 43 13. Factors in external environment 47 14. Attitude towards employee retention 49 15. Change in employee retention strategies 15.1 Due to change in economic environment 50 15.2 Due to change made by the competitor within the industry 51 15.3 Due to more opportunities across industries 52 16. Training budget 16.1 Training budget wrt type of industry 53 16.2 Training budget wrt turnover 54 16.3 Training budget wrt growth rate of employees 55 17. Improving employee commitment 56 18. Measures adopted to create internal environment for employee retention 57 Retention strategies-AIMA
Contents Page No. 19. Promotion from within 19.1 Type of industry 61 19.2 Turnover 62 19.3 Number of employees 63 19.4 Growth of number of employees 64 20. Increase in average compensation package by the organisation 65 21. Increase in compensation package in the industry 69 22. Increase in non monetary package by the organisation in last three years 73 23. Increase in non monetary package by the industry in last three years 75 24. Components of non monetary package 77 25. Relationship between organisation culture and employee retention 78 26. Techniques used for external image building 79 27. Reasons for employees to leave 80 28. Innovative ways to retain employees 82 29. Trigger points to improve retention 83 30. Switchover Inter v/s Intra industry 87 31. Commitment levels 88 32. Subcontracting 89 33. Conclusions 90 ANNEXURES I Questionnaire II List of companies contacted Retention strategies-AIMA
1. Background This is the age of “knowledge workers” and people are the best assets one can have.The corporates are grappling with the problem of high employee turnover and the general exodus of their best talents to the bigger companies and MNCs. Even with the prevailing high rate of unemployment in the country, finding and retaining good and right people is a no mean task. as a result the companies are feeling the need to develop a countrywide company culture to attract and retain best talents. They are trying to be extremely careful in the way they go about selecting the right people. Right now the problem lies in the way in which the HR professionals go about recruiting managers. In most of the companies(barring a handful) the first step in recruiting a candidate is to conduct a group discussion, in which these professionals select a few candidates (rather reject a few) on the basis of entirely subjective judgements, sometimes based on just the appearance of the candidate. Those who are selected after such a process are often not interested in the job or the company and leave within a few months of joining and sometimes they don’t even accept the offer in the first place. Moreover when it comes to the interview the interviewers often come unprepared without doing their homework. They are not clear exactly what they are looking for. The interviewers hardly list down what attitudes, skills, interests, abilities they are looking for in a candidate, what are the weightages of each and how to measure them accurately. This is the reason why we still have managers who worship the proprietor to go up in the corporate ladder. Wide unprofessionalism is one of the main reasons that the MBAs leave companies, frustrated and dejected. And here is where HR can play an effective role. HR management the world over shows that the role of the HR professionals is changing rapidly. They are now more proactive. The primary role of an HR professional in future would be to enable the line managers to perform the role of an HR manager as well as decide on recruitment, training etc. The HR manager’s role will become the role of a missionary, where he empowers, enables the line managers and thereby makes the traditional HR functions of a personnel manager, obsolete. There will only be few HR professionals in the organisation but their roles will be very important. Source: Business Standard Retention strategies-AIMA
1.1 Engagement Objective • To ascertain whether then exist differences between different sizes of employees, different types of industries wrt. retention level. • Identify the key cause-and-effect relationships in maintaining a healthy employee retention level. • Ascertain whether there exist differences between retention level v/s no. of employees & growth in number of employees. • To ascertain whether there exist differences between retention level v/s no. of employees & growth in number of employees. Retention strategies-AIMA
1.2 Research Methodology Information collection Analysis and modelling Report and discussions • Primary research on a sample of 135 in-depth interviews with Indian and multinational companies across various cities and different industry sectors • Secondary research on current body of literature on retention and strategies • Current retention levels • Reasons therein • Key triggers that impact retention • Strategies being used by Corporate India to improve retention levels • Report on current retention levels, relationships, triggers, strategies in use, gaps therein. Retention strategies-AIMA
1.3 Sampling design In-depth interviews were conducted with ten companies to understand the issues involved in retention strategies in Indian scenario. After the questionnaire was drafted pre-test was conducted with three companies. The questionnaires were administered to senior HR professionals in various companies. All the companies contacted had a turnover above Rs. 25 crores. 135 interviews in the form of structured questionnaires were conducted in six cities across India. City No of companies Delhi 71 Bangalore 38 Chennai 7 Ahmedabad 6 Mumbai 8 Jamshedpur 5 The study was focused on sunrise industries like Software Development and telecom which are based in the North and South primarily. Retention strategies-AIMA
2. Profile of companies in sample 2.1 Type of business activities Type of company Number Per-cent Traditional 37 27.0 Marketing 32 24.0 Services 40 30.0 IT & Telecom 26 19.0 • Traditional industry would include Steel, Power, Textiles, Chemicals, Cement, Pharmaceutical • Marketing industry would include FMCG, Food processing, Two Wheelers, Airlines, Tyres, Exports • Services industry would include Advertising, Courier, Consulting, Media, Tourism, Hotels, Financial services, Banking, Insurance • IT & Telecom would include Software, Telecom Services, IT • (The list of companies contacted is in Exhibit - II) • There is an almost equal distribution across the four types of industries considered. • All subsequent analysis is based on this classification. Retention strategies-AIMA
The rate of growth of turnover in last three years in the companies in the sample has been between ten to twenty five per-cent and another 33 percent companies have achieved a growth rate between five to ten percent. There are very few companies whose turnover has been growing too slow or too fast. 2.2 Annual Turnover in the last financial year Turnover Number Per-cent Rs.25- 50 crores 49 36.8 Rs. 50-100 crores 18 13.5 Rs. 100-200 crores 23 17.3 Rs. 200-500 crores 19 14.3 Rs. 500-1000 crores 11 8.3 Greater than Rs. 1000 crores 13 9.8 2.3 Rate of growth of turnover in last three years Growth rate Number Per-cent Less than 5% 7 5.3 5% - 10% 44 33.3 10% - 25% 58 43.9 25% - 50% 12 9.1 More than 50% 11 8.3 Retention strategies-AIMA
2.4 Number of employees ( In Percentage Terms) Turnover/No. of employees 50-100 100-500 500-1000 >1000 Rs. 25-50crores 33 43 20 4 Rs. 50-100crores 17 44 28 11 Rs. 100-200crores - 44 35 21 Rs. 200-500crores - 21 32 47 Rs. 500-1000crores 18 - 18 64 >Rs.1000 crores - - - 100 The companies having a turnover between Rs. 25-200 crores are mostly having between 100-500 employees and also about 30% of these companies are having between 500-1000 employees. Most of the companies whose turnover is between Rs. 200-1000 crores are having more than 1000 employees but some of these companies also have between 500 - 1000 employees. 100% of the companies having more than Rs.1000 crores of turnover have more than 1000 employees. The number of employees is directly proportional to the turnover of the company except in some case. Retention strategies-AIMA
The growth of employees is directly proportional to the growth of turnover of the company to the level of 25% but beyond that any growth in the T/O is does not directly result in the growth of employees in the same proportion. It is lower. 2.41 Rate of growth of number of employees in last three years Growth of employees (in percentage terms) Growth of turnover <5% 5-10% 10-25% 25-50% >50% Less than 5% 71 29 - - - 5%-10% 19 69 12 - - 10%-25% 14 34 48 2 2 25%-50% 18 36 18 18 9 Greater than 50% 18 44 28 6 3 In most of the cases the rate of growth of turnover and the rate of growth of number of employees is same I.e. a majority of companies in each category of rate of growth of turnover have witnessed a same rate of growth in number of employees. Only in case where the growth of turnover is more than 50%, the growth of number of employees is still between 5-10%. These are generally PSUs which are already overstaffed and even when they grow at a very rapid pace, they don’t need to increase the number of employees to that extent. Retention strategies-AIMA
2.42 Comparison of turnover with that of growth of turnover Growth of turnover (In percentage terms) Turnover <5% 5-10% 10-25% 25-50% >50% Rs. 25-50 cr 4 47 35 10 4 Rs. 50-100 cr 11 11 44 11 22 Rs. 100-200 cr 4 26 56 4 9 Rs. 200-500 cr 11 33 33 17 6 Rs. 500-1000 cr - 27 64 - 9 > Rs. 1000 cr - 27 54 9 9 About 50% of the companies in all the turnover categories are growing at the rate between 25-50% in the last three years. The medium sized companies having 50 - 100 crores turnover have shown the maximum growth. Companies can achieve certain high growth rates only after reaching a threshold level of their turnover. Retention strategies-AIMA
The traditional industries largely have more than 1000 employees on their rolls while the service industries have lower number of employees comparatively. 2.43 Number of employees in different types of industries Number of employees (in percentage terms) Type of industry 50-100 100-500 500-1000 >1000 Traditional 11 27 19 43 Marketing 22 22 19 37 Services 13 43 24 19 IT & Telecom 15 31 38 15 About 45% of the traditional companies have more than 1000 employees. These are big companies in infrastructure, power, steel, construction etc. These companies are generally old and very big. About 40% marketing companies also have number of employees more than 1000 but there are 22% companies each who have employees between 50-100 and 100-500. In services industry maximum number of companies have between 100-500 employees. In IT & Telecom industry a majority of companies have between 100-500 and between 500-1000 employees. Retention strategies-AIMA
The largest growth in the number of employees has been witnessed IT & Telecom sector followed by services and then by marketing. The lowest growth of employees has been experienced by the traditional industries. 2.44 Comparison between Type of industry and Growth of employees Growth in number of employees (in percentage terms) Type of industry <5% 5-10% 10-25% 25-50% >50% Traditional 29 50 18 - 3 Marketing 19 45 29 7 - Services 14 51 26 6 3 IT & Telecom 4 27 46 15 8 In traditional industry most of the companies have witnessed the growth of employees between 5-10% or less than 5%. In marketing and services industry the trend is almost similar, with most of the companies having a growth in number of employees between 5-10% and the next lot between 10-25%. In IT & Telecom about 46% companies have growth in number of employees between 10-25%. The highest growth rate in number of employees in maximum number of companies is in IT & Telecom industry. Growth in number of employees Retention strategies-AIMA
Increase in T/O & market share were the common long term goals across the industry segments. However, computerisation and improvement of product and services were important acheivables the services & IT & Telecom companies had laid down. 3. Long term goals TRADITIONALPrimarily all of them mentioned that they want to improve the growth rate and want higher turnover in the future. Some companies also said they want to double their turnover. Also it was stated that high customer satisfaction levels was also very important to achieve. A few companies also said that they would like to expand their activities and take up bigger projects. The companies involved in export wanted to achieve rapid growth for meeting all the export orders. Most of the companies also said that they wanted to increase their profitability and market share by increasing their productivity MARKETINGThese companies too wanted to increase their growth rate and the turnover. Some companies whose turnover was not that much said that their turnover should touch over Rs. 100 crores by year 2000. The companies in food processing business wanted to become the market leaders in their respective categories. Those who were already on No. 1 position wanted to retain their place and also wanted to make their presence felt globally. Some of these companies also mentioned that they want to diversify their product line and have higher growth rates. SERVICES All these companies wanted their growth rates to increase phenomenally and to make their turnover touch the Rs. 100 crores mark by the year 2000. These companies also said that to improve the quality of their services is also one of the main agenda. Some companies said that they wanted to expand their activities of work while others mentioned that they wanted to achieve total computerisation and tight span of control. IT &All these companies wanted to increase their growth rates, they waned to be the leader in their fields and want to make their TELECOM presence felt through out the world. They want to increase the turnover and their market share. Retention strategies-AIMA
The growth in the number of employees, in most cases, is proportional to growth in the industry. 4. Growth of industry 4.1 Rate of growth of industries v/s. Growth of employees Rate of growth of industries (in percentage terms) Growth of employees <5% 5-10% 10-25% 25-50% >50% Less than 5% 32 36 27 - 4 5-10% 2 58 35 2 4 10-25% - 25 61 11 3 25-50% - - 25 62 13 Greater than 50% 33 - - 33 33 The rate of growth of industries in this case pertains to the industry category to which the company belongs. Growth of industry Growth of number of employees Retention strategies-AIMA
4.2 Stage of growth of industry Stage of growth (in percentage terms) Type of industry Infancy Growth Maturity Decline Traditional - 60 35 5 Marketing 3 53 44 - Services 6 58 36 - IT & Telecom 4 56 40 - Across all the industries, all the companies are either in the growth stage or in the maturity stage. About 55 - 60% of the companies in each of the four industries are in growth stage. 4.3 Rate of growth of number of employee v/s. Stage of growth of industry. Stage of growth (in percentage terms) Growth of employees Infancy Growth Maturity Decline <5% 4 58 38 - 5-10% - 60 40 - 10-25% 8 44 47 - 25-50% - 85 14 - >50% - 33 33 33 85% of the companies whose growth of employees is from 25- 50% are in the growth stage. Retention strategies-AIMA
The stage of growth of industry and stage of growth of company are in tandem with one another. All companies have kept pace with their respective industry growth rate. 4.3 Rate of growth of industry and rate of growth of company Rate of growth of company (in percentage terms) Rate of growth Infancy Growth Maturity Decline of industry Infancy 25 50 25 - Growth 3 91 6 - Maturity - 35 64 1 Decline - 50 - 50 Rate of growth of industry Percent Rate of growth of company Retention strategies-AIMA
The growth of turnover and the growth of the industry is almost equal in majority of the companies, almost 60-85% of the companies show this trend. 4.4 Growth of the industries with relation to the growth of turnover of the companies Rate of growth of industry (in percentage terms) Growth of turnover <5% 5-10% 10-25% 25-50% >50% <5% 14 86 - - - 5-10% 14 67 16 2 - 10-25% 2 22 73 2 2 25-50% 8 17 8 58 8 >50% - 9 36 18 36 Within the companies having >50% growth rate of turnover; 36% of the companies have overtaken the industry growth rate. Retention strategies-AIMA
In the IT & Telecom industry segment there are more junior employees compared to others. The middle level is highest in the marketing company senior management is highest in the services industry. The IT & Telecom companies are characterised by a very high number of technical employees across all levels. In all other industries the ratio of technical to non technical is almost the same. 5. Break up of employees 5.1 Break up into Technical and Non Technical Industry : Traditional Industry : Marketing Employees Total % Technical Non Technical Junior 56 62.5 37.5 Middle 24 62.5 37.5 Senior 11 55 45 Top mgmt 3 47 53 Employees Total % Technical Non Technical Junior 56 64 36 Middle 31 58 42 Senior 13 54 46 Top mgmt 6 50 50 Industry : Services Industry : IT & Telecom Employees Total % Technical Non Technical Junior 53 60 40 Middle 26 58 42 Senior 14 50 50 Top mgmt 4 50 50 Employees Total % Technical Non Technical Junior 62 79 21 Middle 26 69 31 Senior 10 60 40 Top mgmt 6 33 67 Retention strategies-AIMA
5.2 Break up of employees department wise INDUSTRY: TRADITIONAL Production Marketing Finance Personnel / IT/Systems Others Administration Junior 52 19 13 11 12 9 Middle 39 14 11 5 8 8 Senior 30 14 7 5 4 6 Top Mgmt 25 14 12 6 5 8 In Traditional industries the production department dominates all the levels of employees. IT/Systems are dominated by the junior level employees. INDUSTRY: MARKETING Production Marketing Finance Personnel / IT/Systems Others Administration Junior 45 16 8 5 6 7 Middle 40 14 9 4 5 8 Senior 35 12 9 4 4 12 Top Mgmt 30 13 15 4 4 11 In Marketing industries too production dominates all employees levels followed by marketing. Retention strategies-AIMA
5.2 Break up department wise INDUSTRY: SERVICES Production Marketing Finance Personnel / IT/Systems Others Administration Junior 35 20 17 9 9 8 Middle 40 22 12 6 4 12 Senior 34 21 14 5 5 6 Top Mgmt 27 21 19 6 5 4 In Services the domination of production is not as high as in Traditional and Marketing. The marketing function too dominates all levels equally. INDUSTRY: IT & TELECOM Production Marketing Finance Personnel / IT/Systems Others Administration Junior 28 19 4 3 41 5 Middle 23 15 3 2 16 4 Senior 21 5 3 2 9 3 Top Mgmt 21 15 9 5 7 15 The IT & Telecom industry segments are dominated by the IT/System at the junior levels. Retention strategies-AIMA
The formal or written job description are prevalent best in the IT & Telecom industry. In the other industries they are left open ended. Written job description limits creativity and flexibility of the job. This was the common belief across all the four industry segments. 6. Job description 6.1 Formal or written job description TRADITIONAL MARKETING SERVICES IT & TELECOM About half the companies said that they do have a written job description but that they keep on expanding it from time to time. Also in most of the companies it is partly formally written and partly not written. In most of the companies the job description is partly written and partly not written. Moreover where ever it is written, it is mentioned in the appointment letter itself. About equal number of companies have a written job description and no formal job description. Moreover some companies are such that they have a written job description for some jobs and for the rest of the jobs it is supposed to be understood in conventional terms. A number of companies feel that it is generally understood in conventional terms but ofcourse it is very much made explicit at the time of the interview. About 50% of the companies felt that there was no need of a formal or written job description. In this industry about 60% of the companies do have a written job description and that too for all levels of employees. The rest 40% companies either have a partly written job description or they don’t have anything written at all in this respect. 6.2 Problems faced due to written job descriptions TRADITIONAL MARKETINGSERVICES IT & TELECOM Most of the companies did not have any problem but according to some it made things very rigid to work out. The only major problem that all the companies faced is that that where ever the written job description is there the employees don’t take initiative to be innovative. It makes the working environment too rigid. There is more flexibility when there is no written job description. Some companies also mentioned that when there is a new concept people don’t take any interest and the additional work never gets done. In this category about 80% of the companies do not think there is any problem due to written job description, those who said that there was a problem said that the employees become very dull and do not use their creativity when set boundaries of work are given to them. Most of the companies did not find any problem but some of them did mention that a written job description does not leave much room for innovation. Retention strategies-AIMA
In all the industry segments there is some change in the nature of work in more than 50% of the companies. In marketing & services the change in nature of work at the time of promotion is to a large extent in larger number of companies. 7. Promotions 7.1 Change in nature of work Extent of change (in percentage terms) Industry No change Some change Large extent Completely at all of change changed Traditional 3 64 33 - Marketing 4 46 50 - Services 3 46 46 5 IT & Telecom 4 60 36 - In 64% of the traditional companies there is some change in the nature of work at the time of promotion and in 33% companies there is a large extent of change. The trend in IT & Telecom industry is also quite similar. In marketing and services industry the distribution between some change and large extent of change is almost same i.e. around 45-50%. Retention strategies-AIMA
7.2 Additional or higher job responsibilities Additional job responsibility (in percentage terms) Industry No addition Some Large extent Ver large extent at all addition of addition of addition Traditional - 44 53 3 Marketing - 35 65 - Services - 42 58 - IT & Telecom - 44 56 - There is a large extent of addition in the job responsibility at the time of promotion in the marketing and services industry. In traditional & IT & Telecom the addition is to a somewhat lower extent. In all the industries except marketing companies, there is large extent of addition in more number of companies and the difference between large extent of addition and some addition is almost 10%. In marketing companies this difference is as much as 30% i.e. in 65% companies there is large addition and in 35% companies there is some addition. Retention strategies-AIMA
8. Employee retention 8.1 Meaning TRADITIONAL MARKETINGSERVICESIT & TELECOM According to these companies, retention means retaining good, hardworking people who work for the benefit of the company. For retaining these people in the company they were ready to pay higher pay packages and were ready to motivate these employees by other means too like providing latest training etc. Some companies said that retention means motivating the employees only while some others did say that it means retaining the whole lot of people. Most of the companies thought that it means retaining good people in the organisation who have key role to play. The turnover of these people should definitely be less than 10%. All the companies unanimously agreed that retaining all the people would do no good to the company. They wanted to retain only those people who would add to the outcome or results of the company in terms of quality goods and services, satisfied customers etc. Very few companies agreed that they would try to keep all the employees in the organisation. Overall about 90% companies wanted that only performing employees should be retained in the organisation. These companies also wanted to retain only good people in their organisation so that they could provide better services to their customers. Some other companies did mention that it means motivating employees so that they don’t think of leaving the organisation or switching jobs frequently. To most of the companies in this industry employee retention means retaining all the people in the organisation and motivating all of them to perform well. These companies said that it would be a waste of effort not to make all of them perform well because a lot has been invested in each one of the employees. Still there were some companies to whom retention meant only retaining good people in the company and making such situation for the non performing employees that they have to quit on their own. Retention strategies-AIMA
8.2 Employee retention: Responsibility w.r.t. type of industry DepartmentPer-cent of response(Overall) HR Department 58 External HR Consultant 0.7 Individual Department 41 Top management 50 Working team 36 Union/Association 16 Type of industry Traditional Marketing Services IT & Telecom (in percentage terms) HR Dept 20 26 26 28 Eternal HR Consultant - - 100 - Individual Dept 25 24 31 20 Top Mgmt 22 22 24 32 Working team 37 24 35 4 Union/Association 50 18 32 - • 58% companies thought that retention was the responsibility of HR Department, and the distribution between the industries is between 20 to 28% in each industry. Just one company employed an external HR consultant. This was a company in the services industry. • It was the responsibility of the individual departments in 41% companies out of which highest 31% belonged to the services sector. • Top management was responsible in 50% of the companies out of which 22% each belonged to the traditional and marketing industries but the highest was seen in IT & Telecom companies. • It was the responsibility of the working team in 36% companies and out of those only 4% belonged to the IT & Telecom industry, the rest were almost equally divided with marketing companies being the lowest. • The unions or association were mentioned by just 16% of the companies and out of that 50% of them belonged to the traditional industries mainly because in these companies the unions are very old and strong. Not even a single company from IT & Telecom has marked this option because this is a new industry and unions are either not there or are not very powerful. Retention strategies-AIMA
8.21 Employee retention: Responsibility w.r.t. number of employees Number of employees 50-100 100-500 500-1000 >1000 (in percentage terms) HR Dept 11 31 23 35 External HR Consultant - 100 - - Individual Dept 13 42 18 15 Top Mgmt 18 42 19 21 Working team 4 26 29 41 Union/Association - 14 45 41 In companies with greater than 1000 employees the HR department is strong. In mid sized companies individual department is responsible along with Top management. The union is responsible only in companies with more than 500 employees. Retention strategies-AIMA
8.22 Employee retention: Area of concern w.r.t. turnover of the companies Turnover (Rs. crores) 25-50 50-100 100-200 200-500 500-1000 >1000 (in percentage terms) HR Dept 32 14 20 18 8 8 Eternal HR Consultant - - 100 - - - Individual Dept 39 13 22 9 9 7 Top Mgmt 42 13 22 12 4 6 Working team 35 14 14 14 12 10 Union/Association 32 9 9 18 18 14 In the 25 - 50 crores turnover companies the responsibility of employee retention is handled by HR department, Individual department, Top management and working team. Unions are responsible in >200 crores turnover companies. In smaller companies the responsibility of employee retention is not well defined. However as the size of the company increases the individual department, Top management and working team are not directly concerned with employee retention. It is the responsibility of the HR department as well as the union. Retention strategies-AIMA
8.3 Employee retention: Problem of retention w.r.t. type of industry Retention problem (in percentage terms) Type of industry Very high Quite high Somewhat Not at all high high Traditional 46 51 - 3 Marketing 34 62 - 3 Services 47.5 47.5 5 - IT & Telecom 73 23 4 - The problem of retention was the highest in the IT & Telecom industry while it was lowest in marketing. Retention strategies-AIMA
8.31 Problem of retention w.r.t. number of employees Problem of retention (in percentage terms) Number of employees Not at all Somewhat Quite high Very high 50-100 62 33 5 - 100-500 57 43 - - 500-1000 47 50 3 - >1000 34 58 3 5 Problem of retention is higher among companies with more number of employees. It increases with the number of employees. This is on account of the bigger companies becoming stagnant & employees wanting to migrate to more attractive smaller set ups. Retention strategies-AIMA
8.32 Problem of retention w.r.t. turnover of the companies Problem of retention (in percentage terms) Turnover (Rs. crores) Not at all Somewhat Quite high Very high 25-50 56 40 2 2 50-100 67 33 - - 100-200 44 52 4 - 200-500 42 53 - 5 500-1000 18 82 - - >1000 42 50 8 - Small sized companies have lesser problem of retention compared to larger companies. Retention strategies-AIMA
The problem of retaining employees was felt in slow growth industries the most. 8.33 Problem of retention w.r.t. Growth rate of industries Problem of retention (in percentage terms) Growth rate Not at all Somewhat Quite high Very high <5% 50 50 - - 5-10% 32 62 2 4 10-25% 61 35 4 - 25-50% 55 45 - - >50% 67 33 - - The companies growing at the rate between 10-25% or between 25-50% or at greater than 50%, all felt that the problem of retention was not at all there but growing between the rate of 5-10% felt that the problem was somewhat there. Retention strategies-AIMA
8.34 Problem of retention w.r.t. Growth rate of turnover Problem of retention (in percentage terms) Growth rate Not at all Somewhat Quite high Very high <5% 57 43 - - 5-10% 35 58 5 2 10-25% 60 36 2 2 25-50% 42 58 - - >50% 40 60 - - The problem of retention is not directly proportional to the rate of growth of the company. In the lower growth companies it is high and in the higher growth companies it is low. It is highest in the medium growth (10 - 25%) companies. Retention strategies-AIMA
In all the industries the turnover in the junior level employees is the most. The top management people are most committed towards the company and don’t leave the company very often. The turnover of the employees at all levels and in all the industries has been the highest in year 1997. 9. Turnover rate 9.1 Turnover rates in last three years Year 1997 1996 1995 Industry TRADITIONAL J 7.0 7.0 6.0 M 5.0 4.5 4.0 S 4.0 3.6 3.8 T 3.2 3.9 4.2 MARKETING J 8.0 7.0 6.0 M 5.0 4.0 4.5 S 3.0 3.5 3.0 T 4.0 1.0 1.5 SERVICES J 8.0 7.5 6.5 M 5.0 5.0 4.5 S 3.0 3.3 2.5 T 2.5 1.0 1.5 IT & TELECOM J 13.0 10.0 7.5 M 4.2 3.7 3.1 S 2.5 2.3 2.0 T - - - In traditional industries the employee turnover rate is continuously increasing in the middle & senior levels while it is low in the top level. In marketing industries the highest turnover rate is in the junior and middle. However, there is a high turnover rate in the top management also. In service industries high turnover rate are witnessed in junior levels and the top end. They are driven by creativity and are in continuos search for newer challenges. In the IT & Telecom industry the highest turnover rate is at the junior level followed by the middle. Retention strategies-AIMA
9.2 Last year turnover rate department wise Technical v/s Non technical Per cent leaving Technical Non Technical last year (turnover) TRADITIONAL Production 5 67 33 Marketing 5 60 40 Finance 5 50 50 Personnel/Admn 4 50 50 IT/Systems - - - MARKETING Production 9 75 25 Marketing 4.5 62 38 Finance 3 50 50 Personnel/Admn 3 47 53 IT/Systems - - - SERVICES Production 6 70 30 Marketing 4.5 53 47 Finance 3.5 32 68 Personnel/Admn 3 35 65 IT/Systems - - - IT & TELECOM Production - - - Marketing 3 23 77 Finance 2 45 55 Personnel/Admn 1.6 40 60 IT/Systems 7.5 80 20 The turnover in the Marketing, Services and IT & Telecom industry is highest in the production, marketing, & IT systems departments respectively. Moreover the turnover in the marketing industry is more in the Technical departments. The same is true for Services. In Services sector however the T/O is high among the non-technical staff like the finance & personnel in case of the finance companies/banks and HR personnel in case of placement consulting companies. These however cannot be deemed as non-technical as they are technical in their own field say the CAs/ICWA’s etc. would be the technical staff for finance companies. In the Telecom companies very high T/O rate is experienced in the technical staff and the non-technical staff in the production department like the operations and maintenance and other support staff. Retention strategies-AIMA
In the traditional industry the replacement rate as well as induction on account of new business has been declining. The induction rate in the marketing industries on a/c of new business has gone up in the junior & middle levels. Replacement rate are however declining. In services industries the induction rate for new business as well as replacement has been continuously declining at all levels. In IT & Telecom the induction rate for new business has seen an upward trend in the senior management level as well as replacement level. 10. Induction rate 10.1 Induction rates in last three years 1997 1996 1995 New Business Replacement New Business Replacement New Business Replacement TRADITIONAL J 37.5 40 43 42 43 40 M 18 14 17 17 18 19 S 10 13 11 12 14 12 T 2.5 2.5 - 5.5 5.0 5.5 MARKETING J 41 36 43 36 41 33 M 33 16 20 15 20 18 S 8 8 10 10 11 9 T 25 10 5 3 15 2.3 SERVICES J 35 38 36 37 38 39 M 14 15 15 15 17 16 S 12 13 12 12 12 12 T 3 4.5 5 7 6 6 IT & TELECOM J - - - - - - M 9.5 7 9.8 5 11 6 S 5.3 4.8 3.5 2.7 2.8 3.0 T 20 16 19 16 24 15 Retention strategies-AIMA
The induction rate is highest in the production department and marketing department among the technical employees across all industries. 10.2 Last year induction rate department wise Technical v/s Non technical Per cent joining last year Technical Non Technical TRADITIONAL Production 7 57 43 Marketing 6 45 55 Finance 4 57 43 Personnel/Admn 3 57 43 IT/Systems - - - MARKETING Production 8.5 67 33 Marketing 4.5 68 32 Finance 3 62.5 37.5 Personnel/Admn 2.3 50 50 IT/Systems - - - SERVICES Production 8 60 40 Marketing 6 47 53 Finance 4.5 44 56 Personnel/Admn 3.5 42 58 IT/Systems - - - IT & TELECOM Production 6.2 56 44 Marketing 3.6 40 60 Finance 2.1 45 55 Personnel/Admn 1.7 45 55 IT/Systems 6 70 30 Retention strategies-AIMA
The retention levels have declined the most in the medium sized companies having turnover between Rs. 200-500 crores. In large companies with >1000 crore turnover the retention levels have increased. Size lends stability to the retention levels. Mid sized companies witness very high volatility while very small and very large companies are stable. 11. Retention levels w.r.t. turnover of the companies Retention levels (in percentage terms) Turnover (Rs. crores) Increased Decreased Remained same 25-50 17 21 62 50-100 33 17 50 100-200 30 17 53 200-500 16 42 42 500-1000 27 27 46 >1000 17 - 83 Retention Levels Retention strategies-AIMA
The retention levels have declined the most among the marketing companies followed by the services industry. However 35% of the marketing companies also reported increased retention levels. Apart from marketing companies in all other industries maximum number of companies about 50 to 70 per-cent said that the retention levels have remained same over the years. 11.1 Retention levels w.r.t. Type of industry Retention levels (in percentage terms) Industry Increased Decreased Remained same Traditional 11 19 70 Marketing 35 26 39 Services 24 26 50 IT & Telecom 19 16 65 11.2 Retention levels w.r.t. Growth of employees Retention levels (in percentage terms) Growth of employees Increased Decreased Remained same <5% 26 26 48 5-10% 10 25 65 10-25% 31 17 52 25-50% 37 25 38 >50% 67 - 33 What ever the growth rate of the number of employees, the highest percentage of the companies have said that their retention levels have remained same. The percentages vary from 38 to 65 percent. Only in companies whose growth rate is greater than fifty percent, the retention level has increased in more number of companies. Retention strategies-AIMA
11.2 Status of retention levels in the last two years and the reasons thereof TRADITIONAL In almost 70 per-cent cases it has been mentioned that retention level has remained the same. In cases where it has increased or remained the same, the reason is that the employees are satisfied with the company, the profits of the company have increased and they don’t want to shift. The employees are happy with the working conditions and the environment of the company. In very few companies the retention levels have decreased and the reasons are that the company is cutting down their activities and one or two companies also said that the employees found that there were better opportunities available in he MNCs and abroad.. More over some companies also mentioned that due to recession people are not leaving the current jobs so the retention levels have increased. MARKETING Most of the companies said that the employee retention levels have increased over the past two years and the main reasons are that there are better career prospects in the company, the company is showing higher profits and good working conditions exist. Some people also mentioned that this industry is growing very rapidly and the company takes good care of its employees. Many companies also mentioned that the companies are on expansion plans and that the employees are paid higher remuneration for their work, they are provided with good working conditions so the retention is not a big problem at all. SERVICES Very few companies in this category also, said that the retention has decreased and the reason that they cite is that some employees leave due to fast promotion opportunities outside in other companies. Other companies mainly said that the retention has increased due to good policies of the company, motivation and good compensation etc. Some other companies said that since there are no jobs in the market so the retention levels have increased as none of the employees want to leave on their own. IT & TELECOM Retention has either increased or remained the same due to better compensation, healthy competitive environment, increase in profitability of the company and good working conditions. Retention strategies-AIMA
12. Attrition TRADITIONAL INDUSTRY • The most important department in which maximum attrition takes place : The dept. in which maximum attention takes place is different across various companies. About 38 percent companies felt that production was the most important department in this context. Another 11 percent companies said that highest attrition rate is in finance department. 8 percent companies thought it to be marketing department. About 5 percent each said that most attrition takes place in engineering and IT department. • The second most important department in which most of the attrition takes place : The second most important department in which the maximum attrition takes place is the finance department as stated by 21 percent of the companies. Another 24 percent companies said it to be marketing department and around 11 percent companies said that it was the production department. The rest was a mixture of design, maintenance and other departments. • The third most important department in which high attrition takes place : The third most important department is the finance department said by 16 percent companies. 24 percent companies said it to be the marketing department. 5 percent companies each said that the third most important department would be personnel and production. Rest of the departments that were mentioned were software, support and IT. Retention strategies-AIMA
12. Attrition MARKETING INDUSTRY • The most important department in which maximum attrition takes place : In marketing industry around 47 percent companies said that maximum attrition takes place in production department. The other departments were materials, operations, software development and travelling. • The second most important department in which most of the attrition takes place : Around 41 percent companies in marketing industry said that the second most important department is the marketing and 19 percent companies said the finance department was the department in which the second highest attrition takes place. 6 percent of the companies said that the department was the production department. The other departments that were mentioned were sales and technical departments. • The third most important department in which high attrition takes place : 22 percent companies said the third most important department in which high attrition takes place is the finance department and another 13 percent said it was the marketing department, 6 percent companies said it to be the administration department. The other departments that were mentioned this were accounts, IT, maintenance, personnel, production and services. Retention strategies-AIMA
12. Attrition SERVICES INDUSTRY • The most important department in which maximum attrition takes place : The most important in which maximum attrition takes place is the finance department. This was stated by as many as 30 percent of the companies. Next 15 percent of the companies said it was the marketing department and another 12.5 percent companies said it to be the production department. The rest of the companies stated different departments such as the administration, the advertisement, the IT, the R &D, and the projects. In this section another important department was mentioned as the creative department in ad agencies where there is maximum attrition. • The second most important department in which most of the attrition takes place : The second most important department in which the second highest attrition takes place is the marketing department as mentioned by 38 percent companies. Another 10 percent companies said it to be the finance department and around 8 percent companies mentioned the production department. The rest of the companies mentioned the other departments such as customer service, personnel. Operations, IT etc. • The third most important department in which high attrition takes place : In the services industry the third most important department where the high attrition takes place is the IT department as mentioned by 23 percent companies. Another 13 percent companies said finance department. 5 percent each mentioned marketing, media and personnel. The rest of the companies mentioned departments such as accounts, operations, production and tenders etc. Retention strategies-AIMA
12. Attrition IT & TELECOM INDUSTRY • The most important department in which maximum attrition takes place : In this industry as many as 50 percent companies said the IT department has the maximum attrition rate. The next 23 percent companies felt it was the marketing department. The rest of the companies mentioned the software development department, the systems department, the sales department etc. • The second most important department in which most of the attrition takes place : Here almost 42 percent companies did not say that any second department existed having high attrition rates. 27 percent companies said it was the marketing department. Around 12 percent companies felt it was the services department and 8 percent companies said it was the operations department. The rest of the companies again mentioned the software development department, production department etc. • The third most important department in which high attrition takes place : 92 percent companies felt that there was no other important department in which the attrition was high and the rest 8 percent companies felt it was the finance department. Retention strategies-AIMA
13. Factors in external environment TRADITIONAL INDUSTRY Mean End of licensing/ Govt. control 2.05 Increased competition from MNCs 2.59 Increased competition from new 2.59 Indian companies Change from cost-plus to market driven 2.65 Emergence of new competing industries 2.59 In the traditional industry most of the companies said that all the factors external to the organisation are some where between not important to important. The end of licensing or government control is more or less not important in having an impact on the employee retention, whereas the factors like increased MNC competition, increased competition from new Indian companies, and emergence of new competing industries almost between not important and important. The factor which has some impact on employee retention is change from cost plus to market driven. In marketing industry the most important factor is the the change from cost plus to market driven, This is stated to be an important factor to impact the employee retention. Another factor which is important in impacting the retention level is emergence of new competing industries. Only Government controls and end of licensing are not important factors but the other two factors such as the increasing MNC competition and increased competition from new Indian companies also are important factors in having an impact over employee retention. MARKETING INDUSTRY Mean End of licensing/ Govt. control 2.23 Increased competition from MNCs 2.74 Increased competition from new 2.58 Indian companies Change from cost-plus to market driven 2.93 Emergence of new competing industries 2.81 Retention strategies-AIMA
13. Factors in external environment SERVICES INDUSTRY Mean End of licensing/ Govt. control 2.06 Increased competition from MNCs 2.70 Increased competition from new 2.59 Indian companies Change from cost-plus to market driven 2.58 Emergence of new competing industries 2.73 In services industry all the factors are important in influencing the employee retention levels except for one which is the end of licensing and government control. This factor is not important, rest of the factors have their skewness towards important in influencing the employee retention the highest being for emergence of new competing industries. IT & TELECOM INDUSTRY Mean End of licensing/ Govt. control 1.96 Increased competition from MNCs 2.77 Increased competition from new 2.23 Indian companies Change from cost-plus to market driven 2.50 Emergence of new competing industries 2.81 In IT & Telecom industry the end of licensing and government control is between not at all important in having an impact on employee retention. Emergence of new Indian companies is also more or less not important for employee retention. The important factors in influencing the employee retention are the emergence of new competing industries and increase in competition from MNCs. Retention strategies-AIMA
14. Attitude towards employee retention TRADITIONAL The attitude towards employee retention is very positive. They want to retain good and loyal people in their companies They want to develop their employees. The positive attitude gives the employees a sense of security and motivates them. They do activities like counselling and promotions are given timely. The employees in this industry get better compensation and pay packages. They want to retain self motivated, hardworking and good people who can be imparted the training and who can show good results for the company. MARKETING To most of the companies it is a matter of concern, companies feel that they want to retain good people who are self motivated, result oriented and more committed.The attitude in this industry is also very positive and supportive. The employees are given better compensation so that they don’t quit. Only those employees who show good results are retained and the rest are either sacked or are made to leave the organisation. The employees are given healthy working environment. It is an area of concern to every one in the organisation. SERVICES In the services industry it is said that good people have to be retained, so they are motivated and kept satisfied. Also it is mentioned that pay the employees better salary and provide them better perquisites as well as training because employee retention is very important for good working of the company. IT & TELECOM The attitude is very positive and pragmatic. A high amount of money is spent on training and better working conditions are provided to the employees to keep their morale high so that they don’t shift the organisation frequently. Retention strategies-AIMA


