Download
1 / 77
770 likes | 916 Vues
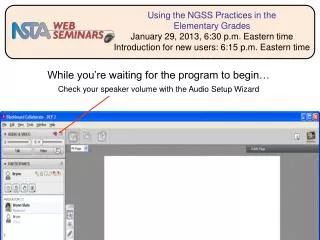
Check your speaker volume—1 of 5. Preparing for NGSS: Analyzing and Interpreting Data October 23, 2012, 6:30 p.m. Eastern time Introduction for new users: 6:15 p.m. Eastern time. While you’re waiting for the program to begin… Check your speaker volume with the Audio Setup Wizard .

E N D
Check your speaker volume—1 of 5 Preparing for NGSS: Analyzing and Interpreting Data October 23, 2012, 6:30 p.m. Eastern time Introduction for new users: 6:15 p.m. Eastern time While you’re waiting for the program to begin… Check your speaker volume with the Audio Setup Wizard
Title slide—Formal warm up, 6:15 p.m., 1 of 13 LIVE INTERACTIVE LEARNING @ YOUR DESKTOP Preparing for NGSS: Analyzing and Interpreting Data Presented by: Ann Rivet October 23, 2012 6:30 p.m. – 8:00 p.m. Eastern time
Agenda—2 of 13 Agenda • Audio setup • Tech support • Interactive tools • NSTA Learning Center resources • Presentation • Evaluation • Informal Q&A
Technical support—4 of 13 Tech Support Jeff LaymanNSTA Technical Coordinatorjlayman@nsta.org703-312-9384 private chat message For additional tech help call Blackboard Collaborate Support 1-877-382-2293 NSTA staff also available to help: Ted Willard Director of NSTA’s efforts around NGSS Brynn Slate Manager of NSTA Web Seminars
Agenda—2 of 13 Preferences • Turn off notifications of other participants arriving • Edit -> Preferences General -> Visual notifications 1 2
Agenda—2 of 13 Using the Chat • During set breaks, the chat will be on • Continue discussion in community forums • NSTA Learning Center, http://learningcenter.nsta.org/discuss/ • Minimize or detach and expand chat panel
Practice poll—7 of 14 Practice using the polling buttons 1 2
Poll—8 of 14 What is your role in education? • Classroom teacher • Principal or administrator • University faculty • Professional development coordinator or curriculum coordinator • Other
Start recording—title slide—1 of 3 LIVE INTERACTIVE LEARNING @ YOUR DESKTOP Preparing for NGSS: Analyzing and Interpreting Data Presented by: Ann Rivet October 23, 2012 6:30 p.m. – 8:00 p.m. Eastern time
About the NSTA Learning Center—3 of 3 NSTA Learning Center • 9,900+ resources • 3,400+ free! • Add to “My Library” to access later • Community forums • Online advisors to assist you • Tools to plan and document your learning • http://learningcenter.nsta.org
Developing the Standards Assessments Curricula Instruction Teacher Development July 2011 2011-2013
NGSS Development Process In addition to a number of reviews by state teams and critical stakeholders, the process includes two public reviews. • 1st Public Draft was in May 2012 • 2nd Public Draft will take place in the Fall of 2012 Final Release is expected in the Spring of 2013 IT’S NOT OUT YET!
A Framework for K-12 Science Education Released in July 2011 Developed by the National Research Council at the National Academies of Science Prepared by a committee of Scientists (including Nobel Laureates) and Science Educators Three-Dimensions: Scientific and Engineering Practices Crosscutting Concepts Disciplinary Core Ideas • Free PDF available from The National Academies Press (www.nap.edu) • Print Copies available from NSTA Press (www.nsta.org/store)
Scientific and Engineering Practices Asking questions (for science) and defining problems (for engineering) Developing and using models Planning and carrying out investigations Analyzing and interpreting data Using mathematics and computational thinking Constructing explanations (for science) and designing solutions (for engineering) Engaging in argument from evidence Obtaining, evaluating, and communicating information
Crosscutting Concepts Patterns Cause and effect: Mechanism and explanation Scale, proportion, and quantity Systems and system models Energy and matter: Flows, cycles, and conservation Structure and function Stability and change
Performance expectations combine practices, core ideas, and crosscutting concepts into a single statement. Closer Look at a Performance Expectation Construct and use models to explain that atoms combine to form new substances of varying complexity in terms of the number of atoms and repeating subunits. [Clarification Statement: Examples of atoms combining can include Hydrogen (H2) and Oxygen (O2) combining to form hydrogen peroxide (H2O2) or water(H2O). [Assessment Boundary: Restricted to macroscopic interactions.]
Closer Look at a Performance Expectation Construct and use models to explain that atoms combine to form new substances of varying complexity in terms of the number of atoms andrepeating subunits. [Clarification Statement: Examples of atoms combining can include Hydrogen (H2) and Oxygen (O2) combining to form hydrogen peroxide (H2O2) or water(H2O). [Assessment Boundary: Restricted to macroscopic interactions.] Performance expectations combine practices, core ideas, and crosscutting concepts into a single statement.
Practices and the NGSS:Analyzing and Interpreting Data Ann Rivet Teachers College Columbia University NSTA Webinar October 23, 2012
Who Am I? Associate Professor of Science Education at Teachers College Columbia University Background in science: physics and earth science Focus on the design of learning environments that support students in understanding the Earth Connections between curriculum, instruction, and assessment
Who Am I? Associate Professor of Science Education at Teachers College Columbia University Background in science: physics and earth science Focus on the design of learning environments that support students in understanding the Earth Connections between curriculum, instruction and assessment Caveats Not part of the Framework development team Not an expert in engineering
Overview What is the practice of analyzing and interpreting data? Why is analyzing and interpreting data important? Connections within the Framework Progression of practice Classroom examples Discussion
Poll: What is Data? • Which of the following do you NOT consider to be data? • Photos • Drawings • Written Observations • Measurements • All of the above can be data
What Does “Analyzing and Interpreting Data” Mean? Data: Facts, statistics, or items of information Analyze: To study or determine the nature and relationship of the parts Interpret: To explain the meaning of
What Does “Analyzing and Interpreting Data” Mean? • Data: Facts, statistics, or items of information • Analyze: To study or determine the nature and relationship of the parts • Interpret: To explain the meaning of • The process of assigning meaning to collected information and determining conclusions, significance, and implications • A function of both the type of information and the question asked
The Practice of Analyzing and Interpreting Data • Practices: Ways of thinking about and working with science concepts to address problems and answer questions • The goal in science is to connect information (in the form of data) to some sort of claim or explanation • In the process of doing so, the information needs to be put in a form where the meaning of the data can be recognized and extracted. • This is the practice of analysis and interpretation • Guiding questions: “What do the data we collected mean?” “How do these data help me answer my question?”
Why Focus on Analyzing and Interpreting Data? Key piece of both the “doing” and “thinking” of science that is often overlooked or skimmed over Central to connecting abstract ideas and concrete examples Uses multiple tools and strategies Engages a wide array of thinking and reasoning skills In engineering, iterative cycles are not just trial and error. They are about figuring out HOW it worked in a particular way and WHY.
Practices and the Framework • Ask questions and defining problems • Developing and using models • Planning and carrying out investigations • Analyzing and interpreting data • Using mathematics and computational thinking • Developing explanations and designing solutions • Engaging in argument from evidence • Obtaining, evaluating, and communicating information
How Relates to Other Practices • Analyzing and interpreting data is the process of connecting information gathered in investigations to explanations, models and arguments through the transformation of data into evidence. • Obtaining evidence is the central purpose underlying data analysis and interpretation • Connected to all the other practices
Guided by Questions and Investigations • Ask questions and defining problems • Developing and using models • Planning and carrying out investigations • Analyzing and interpreting data • Using mathematics and computational thinking • Developing explanations and designing solutions • Engaging in argument from evidence • Obtaining, evaluating, and communicating information
Informed By Models • Ask questions and defining problems • Developing and using models • Planning and carrying out investigations • Analyzing and interpreting data • Using mathematics and computational thinking • Developing explanations and designing solutions • Engaging in argument from evidence • Obtaining, evaluating, and communicating information
Uses Mathematics Tools • Ask questions and defining problems • Developing and using models • Planning and carrying out investigations • Analyzing and interpreting data • Using mathematics and computational thinking • Developing explanations and designing solutions • Engaging in argument from evidence • Obtaining, evaluating, and communicating information
Informs Explanations, Arguments, and Communication • Ask questions and defining problems • Developing and using models • Planning and carrying out investigations • Analyzing and interpreting data • Using mathematics and computational thinking • Developing explanations and designing solutions • Engaging in argument from evidence • Obtaining, evaluating, and communicating information
A Central Practice! • Ask questions and defining problems • Developing and using models • Planning and carrying out investigations • Analyzing and interpreting data • Using mathematics and computational thinking • Developing explanations and designing solutions • Engaging in argument from evidence • Obtaining, evaluating, and communicating information
Questions Questions? Submit your questions and ideas via the chat. • REMINDERS • To turn off notifications of other participants arriving go to: • Edit -> Preferences -> General -> Visual notifications • You can minimize ORdetach and expand chat panel • Continue the discussion in the Community Forums • http://learningcenter.nsta.org/discuss
Tools for Analysis • Tables • Permit major features of data to be summarized in accessible form • Graphs • Visually summarize the data • Mathematics • Expressing relationships between different variables in the dataset • Computer-based “visualization” tools • Allow data to be displayed in a variety of forms • Standard statistical techniques • Help to reduce the effect of error
What Scientists Look For in Data Patterns Significant features Relationships Trends Anomalies
Poll: How Much Do Students Work With Data? • How often do students work with data in your classroom? • At least once a week • Once a month or so • Several times a year • A few times a year • Never
Progression Across Grades Increased sophistication and fluency of the practice of analyzing and interpreting data, and the relationship to other practices, as students move through k-12 science
Analyze and Interpret Data: Grades K-2 Focus on collecting, recording, and sharing observations
Analyze and Interpret Data: Grades K-2 • Share observations Focus on collecting, recording, and sharing observations
Analyze and Interpret Data: Grades K-2 • Share observations • Make measurements Focus on collecting, recording, and sharing observations
Analyze and Interpret Data: Grades K-2 • Share observations • Make measurements • Note patterns and relationships Focus on collecting, recording, and sharing observations
Analyze and Interpret Data: Grades K-2 • Share observations • Make measurements • Note patterns and relationships Focus on collecting, recording, and sharing observations
Analyze and Interpret Data: Grades 3-5 • Emphasize more quantitative approaches, and multiple trials of qualitative data • Display data in tables and graphs • Compare data across different groups • Evaluate claims of cause and effect
? ? Example: Investigating Advantage of Machines Question: How can machines move things that I can’t? Lesson Sequence Incline plane – each group takes one measurement of force and distance for each set-up (one trial). Group measurements are pooled into one class data table. Class discussion of consistency and identification of outliers. Teacher models how to average the data, and how to create comparative bar graphs. Through discussion, class generates interpretations of the analysis by developing initial “class rule” for the relationship.
? ? Example: Investigating Advantage of Machines Lever – Each group conducts one trial of each set-up, gathering both force and distance data. The data from each group is again compiled into class data tables, with a second conversation about consistency and identification of outliers. However, then groups work individually to average and graph the data. These are shared and compared, and the class writes interpretations. They revise their initial “class rule” of the relationship.
? ? ? Example: Investigating Advantage of Machines Distance Force Distance (m) Force (N) With Free Pulley Without Pulley With Fixed Pulley Without Pulley With Free Pulley With Fixed Pulley Pulley – Groups now conduct three trials of each set-up and average their own data. Groups then create comparative bar graphs of both force and distance that include data from the three different configurations. The graphs are compared and discussed. Student groups write their own interpretations of the graphs. The class as a whole revises the “class rule” to include the importance of changing the direction of applied force.
Analyze and Interpret Data: Grades 6-8 • Increased quantitative analyses in investigation, distinguishing causation vs. correlation, basic statistical techniques • Use mean, median, mode and variability to describe data • Identify linear and non-linear relationships using graphs • Consider limitations (e.g., measurement error) and ways to increase precision (e.g., multiple trials) • Use graphical displays of large data sets to analyze temporal and spatial relationships