Download
1 / 47
470 likes | 542 Vues
Explore the economic impact of official liberalizations, ADR, and country fund introduction dates on various financial factors with regression fits and simulation results.

E N D
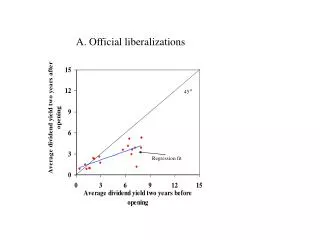
A. Official liberalizations o 45 Regression fit
A. Official liberalizations o 45 Regression fit
A. Official liberalizations o 45 Regression fit
A. Official liberalizations o 45 Regression fit
B. Minimum of official liberalization, ADRand Country Fund introduction dates o 45 Regression fit
B. Minimum of official liberalization, ADRand Country Fund introduction dates o 45 Regression fit
B. Minimum of official liberalization, ADRand Country Fund introduction dates o 45 Regression fit
B. Minimum of official liberalization, ADRand Country Fund introduction dates o 45 Regression fit
C. Net U.S. Equity Capital Flow Break Points o 45 Regression fit
C. Net U.S. Equity Capital Flow Break Points o 45 Regression fit
C. Net U.S. Equity Capital Flow Break Points o 45 Regression fit
C. Net U.S. Equity Capital Flow Break Point o 45 Regression fit
Figure 1The decreasing impact of ADR and Country Fund launchings l=.95 l=.50 l=.05
Unconditional Pre-Event Five-Year Correlations with World Market Return
Figure A1Simulation Results for ReturnsFor r=8% to r=6% mid-sample change andautocorrelation of dividend growth=0.3
Figure A1Simulation Results for ReturnsFor r=8% to r=6% mid-sample change andautocorrelation of dividend growth=0.1
Figure A2Simulation Results for Dividend YieldsFor r=8% to r=6% mid-sample change andautocorrelation of dividend growth=0.1
Figure A2Simulation Results for Dividend YieldsFor r=8% to r=6% mid-sample change andautocorrelation of dividend growth=0.3
Figure 2 The impact of opening capital markets on dividend yields
Figure 3 The impact of opening capital markets on excess returns
Figure 4 The impact of opening capital markets on volatility
Figure 5 The impact of opening capital markets on correlations with world
Economic Impact on Dividend YieldsCountry Moving From 25th Percentile to MedianOfficial Liberalizations
Economic Impact on Dividend YieldsCountry Moving From 25th Percentile to MedianADR, Country Fund, Official Liberalizations
Economic Impact on Dividend YieldsCountry Moving From 25th Percentile to MedianCapital Flow Break Points
Economic Impact on Monthly Excess ReturnsCountry Moving From 25th Percentile to MedianOfficial Liberalizations
Economic Impact on Monthly Excess ReturnsCountry Moving From 25th Percentile to Median ADR, Country Fund, Official Liberalizations
Economic Impact on Monthly Excess ReturnsCountry Moving From 25th Percentile to Median Capital Flow Break Points
Economic Impact on VolatilityCountry Moving From 25th Percentile to MedianOfficial Liberalizations
Economic Impact on VolatilityCountry Moving From 25th Percentile to Median ADR, Country Fund, Official Liberalizations
Economic Impact on VolatilityCountry Moving From 25th Percentile to Median Capital Flow Break Points
Economic Impact on CorrelationCountry Moving From 25th Percentile to MedianOfficial Liberalizations
Economic Impact on CorrelationCountry Moving From 25th Percentile to Median ADR, Country Fund, Official Liberalizations
Economic Impact on CorrelationCountry Moving From 25th Percentile to Median Capital Flow Break Points
Economic Impact on Dividend YieldsCountry Moving From 25th Percentile to MedianADR, Country Fund, Official Liberalizations
Economic Impact on Monthly Excess ReturnsCountry Moving From 25th Percentile to Median ADR, Country Fund, Official Liberalizations
Economic Impact on VolatilityCountry Moving From 25th Percentile to Median ADR, Country Fund, Official Liberalizations
Economic Impact on CorrelationCountry Moving From 25th Percentile to Median ADR, Country Fund, Official Liberalizations
Figure 2 Country Moving From 25th Percentile to Median ADR, Country Fund, Official Liberalizations
Figure 2 (continued) Country Moving From 25th Percentile to Median ADR, Country Fund, Official Liberalizations Financial Development represents the sum of NUMC, CONCR, STDL2, MCAP and STDSTAR. Macroeconomic development is the sum of INFL, FXV, XMGDP and CCR. Financial Liberalization is POST-PRE.