Download
1 / 23
230 likes | 249 Vues
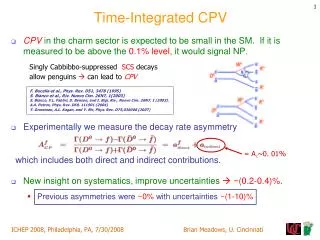
This paper discusses the current status and trends of time-integrated particle measurements in Canada, including long-term mass trends, average seasonal patterns, urban-rural differences, and the importance of sulfate and carbon fractions. The weaknesses in current measurement methods and the need for additional variables are also addressed.

E N D
Time-Integrated ParticleMeasurements : Status in Canada J. R. Brook, T. F. Dann, R. Vet EMEP Workshop on Particulate Matter Measurement & Modeling New Orleans, LA April 2004
Background • Starting in 1970's mass-based PM measurements focused on TSP • Major cities covered with 1-in-6 sampling • selected trace elements (e.g., Pb) and sulfate determined in some geographic areas. • In ~1980 open face filter pack measurements began • Sparked by acid deposition issue • Regionally-representative sites • PM2.5 and PM10 or PMcoarse began in mid 1980s • National Air Pollution Surveillance (NAPS) program dichotomous samplers and Provincial SSI hi-vols • Major cities, 1-in-6 sampling, relatively advanced chemical characterization from NAPS
Current Status • Several Canadian locations have almost a20 year record of PM2.5 and PMcoarse, plus chemical constituents • Chalk River, Ontario, has one of the longest, high-quality daily records of ambient sulfate in North America • Periodic special studies have provided additional chemical characterization and more detail on small-scale spatial patterns • PM2.5 speciation programs enhanced starting in 2000
Long-Term PM Mass Trend inCanadian Major Cities Victoria, Vancouver, Calgary, Edmonton, Winnipeg, Windsor, Toronto, Ottawa, Montreal, Quebec, Saint John and Halifax
Average Seasonal Patterns Egbert, Ontario CAPMoN filter pack (1995-1999)
Average Spatial Patterns Combined CAPMoN CASTNet (USEPA) filter pack (2000-2001)
Urban-Rural Differences Sites are 75-100 km apart in same regional airmass
Characteristics of Air Masses Sutton, Quebec, CAPMoN site 1991-93 PM10 = 15.6 mg m-3 PM2.5 = 12.0 mg m-3 SO42- = 4.4 mg m-3 PM10 = 10.3 mg m-3 PM2.5 = 6.6 mg m-3 SO42- = 1.8 mg m-3
Importance of Sulfate to Summer PM2.5 Episodes NAPS 1995-1998
Montréal Warm Season Sulphate Montréal Cold Season Nitrate Main Constituents “Driving” Episodes Canadian Acid Aerosol Measurement Program 1992-1994
Response to SO2 Emission Reductionsduring cold season: Nov.-Apr. Concentration (mg m-3) Longwoods, Ontario, CAPMoN site
Main Weaknesses • CAPMoN • size-cut uncontrolled • total mass not determined • no measurement of carbon content • NAPS • not daily sampling • nitrate biased low due to analytical protocol • no measurement of carbon content • Special Studies • limited in time and space • few carbon measurements
Carbon Fraction Can't be Ignored(especially since health studies tell us fine mass is important!)
SHEMP Study(daily 24 hr data) Vancouver 7.5 mg m-3Feb. 2000 - June 2002 Toronto 13.2 mg m-3Feb. 2000 - March 2003
Current PM Speciation Monitoringin Canada Sequential dichot Partisol (R&P) for PM2.5 and PMcoarse Sequential R&P chemcomb cartridge-based sampler for PM2.5 speciation
NH4 NH3 Seven Filters for Each Integrated Speciation Sample Period Chemcomb cartridge
Canadian Locations with Fine and Coarse Mass, Fine Mass Speciation 24 hour integrated samples
Downtown Toronto 16 IOGAPS-OCQ 14 IOGAPS-SVOC IOGAPS-OC 12 FP-OC 10 8 OC Concentration (mgC m-3) 6 4 2 0 Fri-D Fri-N Fri-D Fri-N Sat-D Sat-N Sat-D Sat-N Thu-N Tue-D Tue-N Thu-D Thu-N Tue-D Tue-N Thu-D Sun-N Sun-D Mon-D Mon-N Mon-D Mon-N Mon-D Mon-N Wed-D Wed-N Wed-D Wed-N Summer (July 16 to 21), 2001 Winter (March 17 to 24) , 2003 Gas-to-Particle Partitioning of OMand +’ve & -’ve Artifacts Best measure of OC What a single quartz filter sees Maximum size of +’ve artifact
What is in the OM? Another ~15% could be associated with fungal spores (primary biological organic matter) Concentration (ng m-3)
Summary • What have we learned about the PM problems from time-integrated measurements? • Trends, spatial and temporal patterns • What sort of hypothesis testing is being supported by these measurements? • Regional scale source-receptor analyses, contributions from chemical components, changes in composition, interrelationship between constituents • What are the most serious issues vis a vis representing what is actually in the air? • Mass and carbon are operationally defined, carbon artifacts, especially in cities • Are critical variables missing that are needed for the support of hypothesis testing/interpretation of mass and species composition measurements? • Organic speciation, collocated measurements of particles and precursors, size-resolved chemical composition