Weather Index-Based Insurance: Building on Ex-Ante Evaluation in Sudano-Sahelian Zone
10 likes | 127 Vues
Study evaluates weather index insurance for cotton farmers using rainfall data, yield observations, and insurance optimization methods to maximize farmers' income. Results show challenges and potential strategies for improving insurance effectiveness in different regions.

Weather Index-Based Insurance: Building on Ex-Ante Evaluation in Sudano-Sahelian Zone
E N D
Presentation Transcript
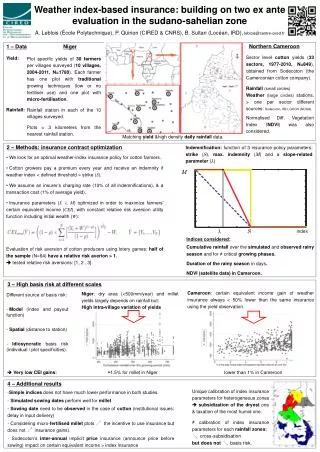
Weather index-based insurance: building on two ex ante evaluation in the sudano-sahelian zoneA. Leblois (École Polytechnique), P. Quirion (CIRED & CNRS), B. Sultan (Locéan, IRD), leblois@centre-cired.fr Northern Cameroon 1 – Data Niger Sector level cotton yields (33 sectors, 1977-2010, N=849), obtained from Sodecoton (the Cameroonian cotton company). Rainfall(small circles) Weather(large circles) stations, > one per sector different sources: Sodecoton, IRD, GHCN (NOAA). Normalised Diff. Vegetation Index (NDVI) was also considered. Yield: Rainfall: Plot specific yields of 30 farmers per villages surveyed (10 villages, 2004-2011, N=1780). Each farmer has one plot with traditional growing techniques (low or no fertiliser use) and one plot with micro-fertilisation. Rainfall station in each of the 10 villages surveyed. Plots < 3 kilometers from the nearest rainfall station. Matching yield &high density daily rainfall data. 2 – Methods: insurance contract optimization Indemnification: function of 3 insurance policy parameters: strike (S), max. indemnity (Μ) and a slope-related parameter (λ) • We look for an optimal weather-index insurance policy for cotton farmers. • Cotton growers pay a premium every year and receive an indemnity if weather index < defined threshold = strike (S). • We assume an insurer’s charging rate (10% of all indemnifications), & a transaction cost (1% of average yield). • Insurance parameters (S, λ, M) optimized in order to maximize farmers’ certain equivalent income (CEI), with constant relative risk aversion utility function including initial wealth (W): • Evaluation of risk aversion of cotton producers using lotery games: half of the sample (N=64) have a relative risk averion > 1. • tested relative risk aversions: [1, 2 , 3]. Μ λ S index Indices considered: Cumulative rainfall over the simulated and observed rainy season and for ≠ critical growing phases. Duration of the rainy season in days. NDVI (satellite data) in Cameroon. 3 – High basis risk at different scales Cameroon: certain equivalent income gain of weather insurance always < 50% lower than the same insurance using the yield observation. Niger: dry area (<500mm/year) and millet yields largely depends on rainfall but: High intra-village variation of yields Different source of basis risk: • Model (index and payout function) • Spatial (distance to station) - Idiosyncratic basis risk (individual / plot specificities). Very low CEI gains: ≈1.5% for millet in Niger lower than 1% in Cameroon 4 – Additional results • Simple indices does not have much lower performance in both studies. • Simulated sowing dates perform well for millet • Sowing date need to be observed in the case of cotton (institutional issues: delay in input delivery) • Considering micro-fertilisedmillet plots the incentive to use insurance but does not insurance gains). • - Sodecoton’s inter-annual implicit price insurance (announce price before sowing) impact on certain equivalent income > index insurance Unique calibration of index insurance parameters for heterogeneous zones subsidization of the dryest one & taxation of the most humid one. ≠calibration of index insurance parameters for each rainfall zones: cross-subsidisation but does not basis risk.