Download
1 / 19
190 likes | 360 Vues
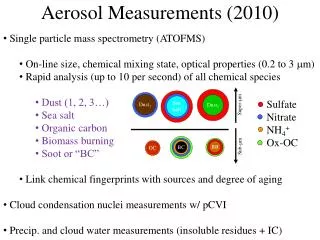
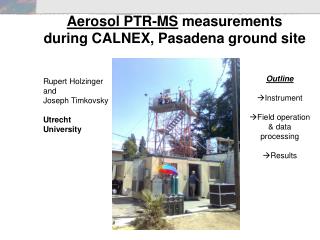
Aerosol PTR-MS measurements during CALNEX, Pasadena ground site. Outline Instrument Field operation & data processing Results. Rupert Holzinger and Joseph Timkovsky Utrecht University. The instrument: High-mass-resolution Thermal-desorption Proton-transfer-reaction Mass-spectrometer

E N D
Aerosol PTR-MS measurements during CALNEX, Pasadena ground site Outline • Instrument • Field operation & data processing • Results Rupert Holzinger and Joseph Timkovsky Utrecht University
The instrument: High-mass-resolution Thermal-desorption Proton-transfer-reaction Mass-spectrometer (hr-TD-PTR-MS)
SumSpectrum, FILE: 2010.05.29-22h27m26s; Detected peaks : 738 Field Operation and Data Evaluation: Data structure: • Full mass scan (10-1200 Da) every 5 seconds • Data files saved every 900 cycles, i.e. 1h 15 min. • 496 data files collected FIRST STEP, initial file evaluation: • mass scale calibration, • peak detection
2nd STEP integrate peak signal mixing ratio: • Cycling repeated every 90 min • Aerosols background every other run
Example, aerosol background: • Inlet A sampled ambient air • Inlet B sampled ambient air through Teflon filter
Results: • Directly comparable to AMS: nitrate and ammonia • Organic constituents • Fraction organic N-compounds
Nitrate: detected at m/z 47.996 (18OON+) Preliminary calibration with ammonium nitrate R2=0.76 • We observe: • Periods with good quantitative and qualitative agreement. Periods with good quantitative agreement. Periods with no agreement. • Conclusion/Question: • Is there a yet unknown effect on the CTD cell? • (Is a major fraction of AMS_NO3 due to organic N species?)
Ammonia: detected at m/z 18.032 (NH4+) R2=0.87 Problem for highest concentrations: Detector saturated Real signal likely 3-4 times higher Results & conclusion: Similar as for nitrate
Organics: detected at 724 m/z ratios • Mass range aerosol species: 28-485 Selection rule: mean(aerosol) > median(background) + 3 * stdev(background)
Total Organics: TD-PTR-MS vs AMS R2=0.49 • PTR-org is 50% of AMS-org during most times. Sometimes more, sometimes less…
Two individual example species: m/z 69.034 high variability, good correlation with AMS-org (r2=0.71) m/z 98.025 lower variability, best correlation with AMS-NH4 (r2=0.75)
Different species: Consistent with C18H9O5ClH+
Fraction of organic nitrogen compounds: • Fraction of N-organics increases with higher aerosol loads! • N1 and N2 species
Comparison N1-organics and N2-organics • Both N1 and N2 organic fractions increase during pollution event. • Different diurnal cycle.
Subset of N-organics with good confidence for correct identification • Accuracy for Formula attribution is considered +/-2mDa for most species. Species with non-N option in the +/-3mDa range were removed from the set. • Same message as for the complete set. The fractions decrease but this is trivial.
Next steps: • Manual inspection of all peaks/empirical formulas. • Should some of the N-peaks be better attributed to organosulfates? • Exploit stable isotope information. • More clues from thermograms? • Take home message: • N organics may constitute more than 35% of the measured organic burden. • TD-PTR-MS measurements may allow constraining the role of N-chemistry for SOA formation at the Pasadena site. • Can it be that AMS-NO3 and AMS-NH4 originate partly from organic species?