Download
1 / 23
230 likes | 249 Vues
Learn about the population growth, labor shed, commuting patterns, educational attainment, housing affordability, and transportation trends in the Capital Area Consortium as part of the Sustainable Places Project. Discover the current challenges and future goals for creating sustainable communities. Get insights into the demonstration sites and sustainability initiatives that aim to enhance mobility choices, housing options, economic prosperity, and environmental quality.

E N D
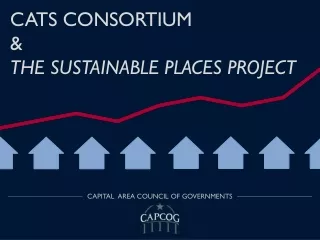
CATS CONSORTIUM & the Sustainable Places Project CAPITAL AREA COUNCIL OF GOVERNMENTS
POPULATION GROWTH – 2000 to 2010 The Capital Area grew from 1.3 million to more than 1.8 million residents between 2000 and 2010, an increase of 36 percent. THE CAPITAL AREA COUNCIL OF GOVERNMENTS │ CATS CONSORTIUM REGIONAL OVERVIEW │ APRIL 27, 2012
POPULATION GROWTH – DISTRIBUTION OF GROWTH CITIES 71% 29% THE CAPITAL AREA COUNCIL OF GOVERNMENTS │ CATS CONSORTIUM REGIONAL OVERVIEW │ APRIL 27, 2012
POPULATION GROWTH – DISTRIBUTION OF GROWTH For every 100 new residents the Capital Area has added since 2000, cities gained the following number of people: THE CAPITAL AREA COUNCIL OF GOVERNMENTS │ CATS CONSORTIUM REGIONAL OVERVIEW │ APRIL 27, 2012
REGIONAL LABOR SHED PERCENTAGE OF WORKERS EMPLOYED OUTSIDE THEIR COUNTY OF RESIDENCE NUMBER OF WORKERS LEAVING THE COUNTY FOR WORK 23K 1K 10K 13K 7K 43K 5K 4K 132K 124K PERCENTAGE OF WORKERS EMPLOYED INSIDE THEIR COUNTY OF RESIDENCE THE CAPITAL AREA COUNCIL OF GOVERNMENTS │ CATS CONSORTIUM REGIONAL OVERVIEW │ APRIL 27, 2012
WORKERS RESIDING WITHIN EACH COUNTY RESIDENTS WORKING IN OTHER COUNTIES ― BY PLACE OF EMPLOYMENT ― ― BY PLACE OF RESIDENCE ― Williamson 27.2% Travis 44.5% 178,589 46.2% 0.3% 1.2% 0.6% KEY 24.8% 0.1% 1.5% 0.7% Bastrop Caldwell Hays Travis Williamson 13.5% 50.5% 68.9% 449,510 6.0% 2.0% 0.2% 0.1% 4.0% 0.8% 4.2% 4.3% 1.3% 9.4% 39.2% 53.8% 20.6% Hays Bastrop 1.6% 1.9% 1.7% 0.4% 31,210 2.9% 2.7% 3.6% 13.5% 2.7% 41.0% 6.2% 30.0% 2.5% 1.4% 1.2% 60,176 0.3% 13.7% 42.5% 37.0% 26.4% 4.6% 11.9% 6.4% Caldwell 16,565 0.6%
DAILY COMMUTING PATTERNS - BASTROP COUNTY 29,391 5,392 6,010
DAILY COMMUTING PATTERNS - CALDWELL COUNTY 13,368 3,200 2,313
DAILY COMMUTING PATTERNS - HAYS COUNTY 40,594 25,256 15,338
DAILY COMMUTING PATTERNS - TRAVIS COUNTY 132,955 288,813 289,129
DAILY COMMUTING PATTERNS - WILLIAMSON COUNTY 124,100 59,718 49,877
PEOPLE – MEDIAN AGE (2008-2010) AUSTIN MSA COUNTY POPULATION 10,000 100,000 THE CAPITAL AREA COUNCIL OF GOVERNMENTS │ CATS CONSORTIUM REGIONAL OVERVIEW │ APRIL 27, 2012 1,000,000
IN-MIGRATION 2008-2009 BY EDUCATIONAL ATTAINMENT Less than College College Graduate (Value in Parentheses) 47.3% 36.5% 34.1% 8.8% 13.3% COUNTY POPULATION 10,000 100,000 THE CAPITAL AREA COUNCIL OF GOVERNMENTS │ CATS CONSORTIUM REGIONAL OVERVIEW │ APRIL 27, 2012 1,000,000
HOUSING AFFORADABILITY (2000) AFFORDABLE UNAFFORDABLE THE CAPITAL AREA COUNCIL OF GOVERNMENTS │ CATS CONSORTIUM REGIONAL OVERVIEW │ APRIL 27, 2012
HOUSING AFFORDABILITY (2008-2010) AFFORDABLE UNAFFORDABLE THE CAPITAL AREA COUNCIL OF GOVERNMENTS │ CATS CONSORTIUM REGIONAL OVERVIEW │ APRIL 27, 2012
MEANS OF TRANSPORTATION TO WORK Drove Alone 75.6% Carpooled 10.5% Telecommute 7.3% Public Transit 2.3% Other Means 4.3% (includes walking, biking, and motorcycle) THE CAPITAL AREA COUNCIL OF GOVERNMENTS │ CATS CONSORTIUM REGIONAL OVERVIEW │ APRIL 27, 2012
CHANGES EXPECTED FOR AIR QUALITY STANDARDS THE CAPITAL AREA COUNCIL OF GOVERNMENTS │ CATS CONSORTIUM REGIONAL OVERVIEW │ APRIL 27, 2012
TROUBLESOME TRENDS CONTINUE • Growth rate constant for unincorporated areas • Majority of workers go to another county for their job • Employability linked to improved education & training • Housing continues to be less affordable • Single occupant vehicles still primary commute choice THE CAPITAL AREA COUNCIL OF GOVERNMENTS │ CATS CONSORTIUM REGIONAL OVERVIEW │ APRIL 27, 2012
DEMONSTATION SITES… WHAT ARE WE DEMONSTRATING? • Mobility choices connecting people • Housing for workers, free agents, boomers, young as well as elderly families • Concentrated growth to maximize infrastructure • Economic prosperity; training = jobs • Healthy communities & public spaces • Community goals optimize natural resources THE CAPITAL AREA COUNCIL OF GOVERNMENTS │ CATS CONSORTIUM REGIONAL OVERVIEW │ APRIL 27, 2012
DEMONSTRATING SUSTAINABILTY… • Activity Center Concept in MPO 2035 Plan – basis for project with focus on demo sites • Sustainable Places Analytic Tool will monetize public & private investment for ROI, land use/growth patterns, health/social impact with real-time scenario building • Outreach to ensure collaboration among demo sites while regional sharing of case studies THE CAPITAL AREA COUNCIL OF GOVERNMENTS │ CATS CONSORTIUM REGIONAL OVERVIEW │ APRIL 27, 2012
PROJECT SCHEDULE: • April 2012 – Stakeholder Committee Kickoff • May 2012 – Consultants Contracted • October 2012 – Charrettes Conducted with SPP Analytics Tool • April 2013 – Catalyst Sites Identified • October 2013 – Final Implementation Plans THE CAPITAL AREA COUNCIL OF GOVERNMENTS │ CATS CONSORTIUM REGIONAL OVERVIEW │ APRIL 27, 2012
PROJECT MISSION Realization of the importance and feasibility of integrating housing, mobility, and economic development to leverage public & private sector investment, thereby creating long term prosperity at the local level and long term benefits at the regional level. THE CAPITAL AREA COUNCIL OF GOVERNMENTS │ CATS CONSORTIUM REGIONAL OVERVIEW │ APRIL 27, 2012
THANK YOU Capital Area Council of Governments www.capcog.org Sustainable Places Project Chad Coburn, Director ccoburn@capcog.org 512.916.6012 THE CAPITAL AREA COUNCIL OF GOVERNMENTS │ CATS CONSORTIUM REGIONAL OVERVIEW │ APRIL 27, 2012