Download
1 / 31
310 likes | 418 Vues
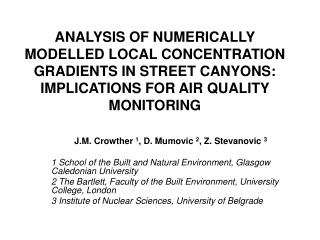
ANALYSIS OF NUMERICALLY MODELLED LOCAL CONCENTRATION GRADIENTS IN STREET CANYONS: IMPLICATIONS FOR AIR QUALITY MONITORING. J.M. Crowther 1 , D. Mumovic 2 , Z. Stevanovic 3 1 School of the Built and Natural Environment, Glasgow Caledonian University

E N D
ANALYSIS OF NUMERICALLY MODELLED LOCAL CONCENTRATION GRADIENTS IN STREET CANYONS: IMPLICATIONS FOR AIR QUALITY MONITORING J.M. Crowther 1, D. Mumovic 2, Z. Stevanovic 3 1 School of the Built and Natural Environment, Glasgow Caledonian University 2 The Bartlett, Faculty of the Built Environment, University College, London 3 Institute of Nuclear Sciences, University of Belgrade
Objectives of this study • To analyse numerically modelled, local concentration gradients in street canyons • To make recommendations for the positioning of air quality monitoring stations
Cases Studied • A single street canyon • A staggered cross-road • An idealised complex configuration of several street canyons
Methodology • PHOENICS with different turbulence models: • Standard k-epsilon • Renormalisation group k- model • Chen-Kim modification of k- model • Two-scale k-
Validation • Comparison with air quality data collected for Glasgow city Council, Scotland • Wind tunnel data from the University of Hamburg, Germany
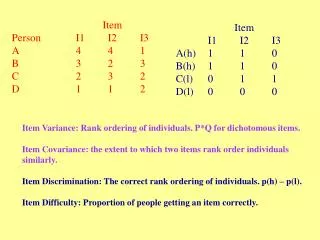
Incompressible, Steady-state Navier Stokes equations k = turbulence kinetic energy per unit mass Ui = mean velocity, ui = turbulence velocity P = pressure, = density, μ = dynamic viscosity t = turbulent viscosity
Pollutant Transport Equations Conservation of Pollutants Turbulence Contribution to the Pollutant Flux D = Laminar Diffusivity, C = Turbulent Schmidt No.
General Transport Equation Property with source S and diffusivity
Standard k- Turbulence Model k=1.0, =1.314, C1=1.44, C2=1.92, C= 0.09
RNG k- Turbulence Model o= 4.38, = 0.012 k=0.7914, =0.7914, C1=1.42, C2=1.68, C= 0.0845
Chen-Kim k- Turbulence Model k= 0.75, =1.15, C1 =1.15, C2 =1.9, C3 = 0.25, C= 0.09
Case 1: Single Street Canyon • Hope Street, Glasgow • Three-dimensional: wind direction at normal incidence • Ref. Mumovic & Crowther, 2002 • Four different turbulence models • Longitudinal single vortex
Case 1 Standard k- model Single Street Canyon Pollutant Dispersion
Case 1 RNG k- model Single Street Canyon Pollutant Dispersion
Case 1 Chen-Kim k- model Single Street Canyon Pollutant Dispersion
Case 1 Two-Scale k- model Single Street Canyon Pollutant Dispersion
Case 1 Single Street Canyon Comparison of a wind- tunnel study (Pavageau & Schatzmann, 1999) with the RNG turbulence model
Case 2: Staggered Cross-Road • University of Hamburg wind-tunnel test • Ref Mumovic, Crowther & Stevanovic, 2003a • Ref. Mumovic, Crowther & Stevanovic, 2003c
Case 3: Complex Configuration of Street canyons • Wind-tunnel study University of Hamburg • Ref. Crowther, Mumovic & Stevanovic, 2003a, b
Case 3 Complex configuration of street canyons: vertical plane at centre of 5th cavity
Case 3: Concentration distribution in the mid-height horizontal cross-section of the 5th cavity
Experimental Concentration Contours: Horizontal Cross-Section, Mid-Height, 5th Canyon
Practicality of Location Suitable Location Local Concentration Gradients Level of Turbulence Factors for Location of Monitoring Equipment