Notation
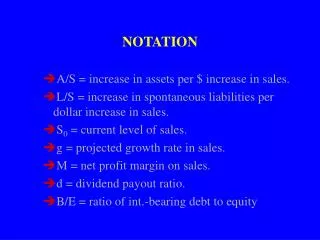
Notation . It hurts now, but will make things easier later. Vectors, Matrices and realizations. This course will be a bit heavy on notation. However, I will try to be consistent. Capital letters represent either matrices or random variables. Small letters will be for specific realizations.


Notation
E N D
Presentation Transcript
Notation It hurts now, but will make things easier later.
Vectors, Matrices and realizations • This course will be a bit heavy on notation. However, I will try to be consistent. • Capital letters represent either matrices or random variables. • Small letters will be for specific realizations. • Vectors in bold type
Outcomes and Explanatory variables • Yij will represent a response variable, the jth measurement of unit i. • xij = (1, xij1, xij2,..., xijp) will be a vector of length p+1 of explanatory variables observed at the jth measurement. • j = 1,ni. i=1,m. • E(Yij)=ij, Var(Yij)=vij
Nesting Observations (measurement within individual) • Set of repeated measures for unit i are collected into a ni-vector Yi=(Yi1,Yi2,...,Yini). • Yi has mean, E(Yi)=i and ni x ni covariance matrix Var(Yi)=Vi. • The jk element of Viis the covariance between Yij and Yik, that is Cov(Yij,Yik)=vijk. • Riwill be the ni x ni correlation matrix of Yi.
Combining all observations into a big data set. • We will lump the responses of all units into one big vector Y=(Y1,...Ym) which is an N-vector (total number of observations): • Most of the course will focus on regression models of the sort:
Combining, cont. • We can write the model for the ith person as • and for the entire data as:
Example 1: Sex and drug/alcohol use YijXij1 id datentry sx24hrs drgalcoh fcondom mcondom 1. 10122 03 Nov 98 no yes -88 -88 2. 10123 03 Nov 98 no no -88 -88 3. 10123 03 Nov 98 no no -88 -88 4. 10123 04 Nov 98 no no -88 -88 5. 10123 03 Nov 98 no no -88 -88 6. 10123 03 Nov 98 no no -88 -88 7. 10123 04 Nov 98 no no -88 -88 8. 10123 03 Nov 98 no no -88 -88 9. 10123 04 Nov 98 no no -88 -88 10. 10123 03 Nov 98 no no -88 -88 11. 10123 03 Nov 98 no no -88 -88 12. 10123 03 Nov 98 no no -88 -88 13. 10123 04 Nov 98 yes no 0 0 14. 10123 03 Nov 98 no yes -88 -88 15. 10123 04 Nov 98 yes no 0 1 16. 10123 03 Nov 98 yes no 0 0 17. 10123 03 Nov 98 no no -88 -88
Merits of Longitudinal Studies over X-sectional studies • Consider the model: • L represents the expected change in Y given a change in Xij relative to the baseline value (Xi1) - longitudinal effect. • C represents the expected difference in average Y across two sub-populations that differ by their baseline values, Xi1 - cross-sectional effect.
Only X-sectional Data • In a x-sectional study, only can estimate: • Can use cross-sectional data to estimate longitudinal effect only if C=L.
Other Merits of Longitudinal Studies • Other merits include is the ability to distinguish the degree of variation in Y across time for one person from the variation in Y among persons. • Efficiency
Method One for Dealing with Repeated Meausures - Basic Methods for working with a family of simultaneous inferences. Ref: Miller, R. Simultaneous Statistical Inference
If repeated measures are made "regularly" (in time, location, etc.) on the subjects, one can look at each measurement separately and perform a number of univariate analyses. • However, one should(?) account for the fact that several simultaneous tests/confidence intervals were performed.
Specifying the family of inferences. • The nonmultiple comparisonists who regard each separate statistical statement as a family is one extreme. • The ultraconservatives who have a single family consisting of every statistical statement they might make during their lifetime as they other extreme.
Global level of significance - or type I error (0) and global confidence level (C0). • C0= P(All the condifidence intervals, CI’s, in the specified family cover their respective parameters) • 0 = P(one or more type I errors in the specified family of significance tests) • k,Ck are the levels of significance and confidence levels for each member of the family k=1,..,K. • One finds the k (or Ck)that gives an 0(orC0).
Independent vs. dependent tests (CI’s). • One needs to specify whether the results of your set of inferences tests/confidence intervals are independent or dependent. • Statistical independence implies P(reject null on test j | result of test k) = P(reject null on test j).
Independent CI’s • Suppose there are K independent events, E1,E2,...,EK. • Let Ek be a confidence interval, then • P(Ek) = P(kth CI covers parameter of interest)=Ck • C0=overall confidence level = P(all K intervals cover their respective parameters
Independent CI’s, cont. • C0=overall confidence level = P(all K intervals cover their respective parameters • Using equal confidence levels for each inference gives:
Independent Tests • 0 = overall type I error probability = P(1 or more type I errors in K-tests) • 0 = 1-P(no type I errors in K-tests) =
Independent Tests, cont. • Using equal significance levels for each test, one can solve for k: • So, using this k will achieve the desired overall 0.
Dependent Events • Suppose now there are K dependent events, E1,E2,...,EK. • Global C0 and 0 are based on Bonferroni’s Inequality: • Hochberg & Tamhante (1987), Multiple Comparison Procedures.
Dependent CI’s • P(Ek) = P(kth CI covers parameter of interest)=Ck • C0=overall confidence level = P(all K intervals cover their respective parameters). • Using equal Ck,
Dependent CI’s, cont. • So, to achieve desired C0,such that C0 = 1-K(1-Ck) is equivalent to using: Ck = 1-(1- C0)/K
Dependent Tests • 0 = 1-P(no type I errors in K-tests) = • Therefore, 0 1-(1-Kk)=Kk.
Dependent Tests • So, using k = 0/K will achieve desired overvall level 0.
Homework 1 • For Example 2.2 in Crowder and Hand (pg 9), provide individual confidence intervals for the difference in mean response of Drug A vs. Drug B for the 4 time measurements. • In addition, what individual -levels would you need to give 0 = 0.10 for the test of the null hypothesis that the means in the two drug groups are the same. • Finally, define a global p-value.