Download
1 / 39
390 likes | 553 Vues
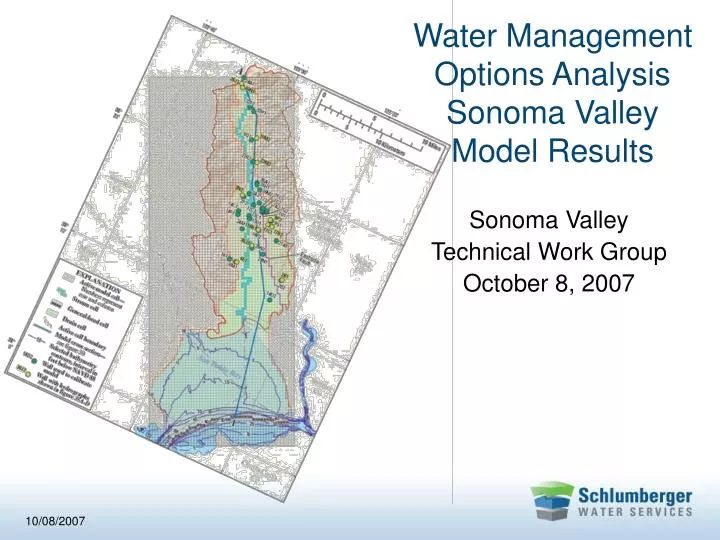
Water Management Options Analysis Sonoma Valley Model Results. Sonoma Valley Technical Work Group October 8, 2007. 10/08/2007. Sonoma Valley Model 1974-2000 Results 6,000 to 8,500 AFY demand increase 17,300 AF decrease in storage Localized groundwater declines

E N D
Water Management Options Analysis Sonoma Valley Model Results Sonoma Valley Technical Work Group October 8, 2007 10/08/2007
Sonoma Valley Model • 1974-2000 Results • 6,000 to 8,500 AFY demand increase • 17,300 AF decrease in storage • Localized groundwater declines • Limitations – Model does not • Adequately represent basin complexities • Model salinity intrusion • Include accurate groundwater production • Include adequate surface water flow data • Consider seasonal variations • Model Use • Provides a tool for assessing conceptual water management options
Sonoma Valley Groundwater Demand 1974 - 2000 Reference: USGS SIR 2006-5092
Year 2000 Total Water Use Groundwater Use Notes: SW – surface water GW – groundwater AF – acre-feet References: USGS, 2006 for estimates of domestic and agricultural groundwater use City of Sonoma and Valley of the Moon Water District 2005 Urban Water Management Plans for estimates of urban groundwater use (Brown & Caldwell, February and August 2007).
How was the Model used? Simulation of a complex subsurface system Simulation of the groundwater budget for the Sonoma Valley basin over 2001-2030 Evaluation of 12 separate simulations, combining four water management options and two scenarios under varying hydrologic conditions The model, in its current state, has limitations but is suitable for this type of narrow analysis
Model set up • 13 X 33 mile area • 133 rows • 52 columns • General head boundary south bay • Drain boundary layer 1 Inactive cells General Head boundary Drain boundary
Location of Pumping Wells in the Model • Model Agricultural Wells • Model Private Domestic Wells • Model Urban Supply Wells (City of Sonoma) • Model Urban Supply Wells (Valley of the Moon Water District) • Note: Locations shown are approximate. • Model wells are shown at the center of the grid cell to which they are assigned. Some grid cells contain multiple wells • Reference: Map from USGS, 2006.
No Additional Action N-0 A (Storm Water Recharge) N-4a B (Groundwater Banking) N-4b C (Recycled Water) N-4c D (Conservation) N-4d A,B,C,D N-5 No Additional Action N-1 A,C,D N-3 A,B,C,D N-6 No Additional Action D-0 A,B,C,D D-6 Model Cases No Additional Imported Water Beyond Existing Water Rights Normal Year Additional Imported Water No Additional Imported Water Beyond Existing Water Rights Multiple Dry Year C,D Additional Imported Water D-2
Hydrologic Scenarios Normal Year Multiple Dry Year
What are the Demand Assumptions? From year 2001 – 2030: • Agricultural groundwater demand increase based on land use increases by 2,250 acres • Private domestic groundwater demand increases according to projected population growth • Urban groundwater demand increases unless additional imported urban supply is obtained Additional model assumptions: • No seasonal variations • Recharge reaches the water table immediately
Option AStorm Water Recharge • Wet season flood waters diverted into recharge ponds and/or wetlands along Sonoma Creek • Recharge ponds placed in areas of highest drawdown along Sonoma Creek • cover 80 acres • loading of 0.1 ft/d for 120 days/year • 960 AF per year • Implementation in 2015 • Total volume 15,360 AF over 16 years (2015-2030) Stormwater Recharge Basin Cells
Option BGroundwater Banking • Groundwater banking of imported winter surplus water • Two groundwater recharge wells placed in area where model shows highest drawdown • Recharging middle aquifer zone • Rate 1cfs (465 gpm) per well • Average 1,500 AF per year total for both wells • Implementation in 2015 • Total volume 24,000 AF over 16 years (2015-2030); 1 cfs per well Groundwater Banking
Option CRecycled Water Recycled Water • Alignment 1 in Sonoma Valley Recycled Water Draft Feasibility Study (Agency, 2005) • In lieu agricultural irrigation • 1,100 AF per year starting in 2010 • Phased implementation • Total volume 23,100 AF over 21 years (2010-2030)
Option DIncreased Conservation • Urban groundwater demand: • 2001-2009 – Tier One To-Date and plumbing code conservation measures • 2010-2030 – All measures (Tier One Future, 50 % of Tier Two, New Development, Plumbing Code) • Projections provided by Agency • Domestic groundwater demand: • 2005-2014 – linear ramp up • 2015-2030 – 8.3% conservation • Agricultural groundwater demand: • 2005-2014 – linear ramp up • 2015-2030 – 5% conservation Conservation
Simulated Drawdown2001-2030 • Case D-0 • 30-yr dry weather scenario • No additional imported water • No additional action Change in Storage -22,000 AF
Simulated Drawdown2001-2030 • Case N-0 • 30-yr normal weather scenario • No additional imported water • No additional action Change in Storage -18,900 AF
Simulated Drawdown2001-2030 • Case N-1 • 30-yr normal weather scenario • Additional imported water • No additional action Change in Storage -16,000 AF
Simulated Drawdown2001-2030 • Case D-2 • 30-yr dry weather scenario • Additional imported water • Recycled water & conservation options Change in Storage -10,900 AF
Simulated Drawdown2001-2030 • Case N-3 • 30-yr normal weather scenario • Additional imported water • Stormwater recharge, recycled water & conservation options Change in Storage -5,700 AF
Simulated Drawdown2001-2030 • Case N-4b • 30-yr normal weather scenario • No additional imported water • Groundwater banking Change in Storage -1,600 AF
Simulated Drawdown2001-2030 • Case N-5 • 30-yr normal weather scenario • No additional imported water • Stormwater recharge, groundwater banking, recycled water, and conservation Change in Storage +8,400 AF
Simulated Drawdown2001-2030 • Case D-6 • 30-yr dry weather scenario • Additional imported water • Stormwater recharge, groundwater banking, recycled water, and conservation Change in Storage +8,400 AF
Simulated Drawdown2001-2030 • Case N-6 • 30-yr normal weather scenario • Additional imported water • Stormwater recharge, groundwater banking, recycled water, and conservation Change in Storage +11,100 AF
What Did We Learn? • Based on projected demand, the basin groundwater levels and storage will continue to decline • Active water management is necessary in the future to minimize and potentially mitigate declines • Groundwater banking (Option B) is the most effective water management option considered • It is the only option which provides a positive basin groundwater storage result • All water management options should be utilized to improve water supply reliability for future generations
What’s the Model Been Telling Us? • Declining groundwater storage and levels • Water management is necessary • Groundwater Banking • Provides the greatest increase in storage • The only option that provides sustainable groundwater conditions in basin
Why is the Model Helpful? • It allows us to look at the amount of water entering and exiting the basin • A groundwater model is the best tool available for predicting future groundwater conditions • Despite its limitations, it is a useful tool for comparing various proposed water management options
How Can We Use the Results? The results…. • Can help prioritize water management options • Confirm the need for active water management • Help identify the areas of largest deficit • Help identify additional data and enhancements needed for the model
For What Can the Results NOT Be Used? • Detailed siting and design of water management options • Local-scale evaluation of groundwater conditions • Limitations • Uncertainty in key input data • Deep lateral in/outflows not considered • Limited data on Sonoma Creek • Large regional-scale model • Freshwater conditions • Fully saturated conditions
Sensitivity Analysis Model most sensitive to • Recharge • Sonoma Creek streambed conductance • Horizontal hydraulic conductivity in north basin
How Will the Model be Improved? Improved characterization of…. • Amount and distribution of recharge • Sonoma Creek gains and losses • Hydrogeologic conceptualization • Groundwater level and groundwater quality • Groundwater production through updated land use survey and use estimation