Download
1 / 33
330 likes | 403 Vues
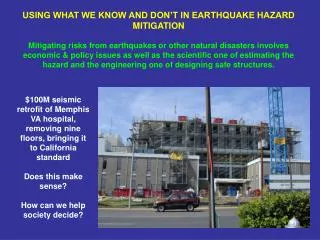
Developing strategies to mitigate natural hazard risks involves estimating the hazard, balancing costs, and assessing probabilities of rare events. Uncertainty in predicting “black swan” events poses challenges. The intersection of geoscience, mathematics, and economics is crucial for formulating rational hazard policies. Recent events like the 2011 Tohoku earthquake highlight the need for better mitigation strategies. Rebuilding for past disasters may not always be effective, necessitating a multidisciplinary approach to assess risks and devise cost-effective policies. Systems analysis can aid in formulating rational policies that consider uncertainties and potential threats effectively.

E N D
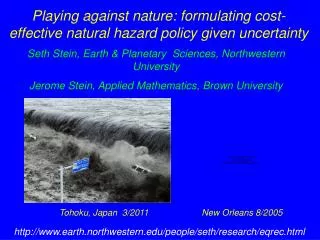
Playing against nature: formulating cost-effective natural hazard policy given uncertainty Seth Stein, Earth & Planetary Sciences, Northwestern University Jerome Stein, Applied Mathematics, Brown University Tohoku, Japan 3/2011 New Orleans 8/2005 http://www.earth.northwestern.edu/people/seth/research/eqrec.html
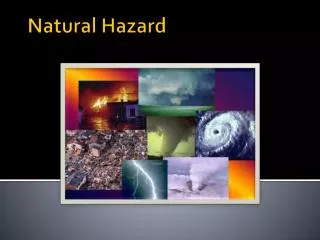
Developing strategies to mitigate risks posed by natural hazards depends on estimating the hazard and the balance between the costs and benefits of mitigation. The major uncertainty is the probabilities of the rare, extreme, and most damaging “black swan” events. Often these probabilities are difficult to estimate because the physics is not adequately understood and the short geologic record provides only a few observations. Mitigation policies typically made without rational analysis of costs & benefits How to do better is complex challenge at the intersection of geoscience, mathematics, and economics.
Tohoku, Japan March 11, 2011 M 9.1 CNN NY Times Rare, extreme event illustrates challenge Hazard was underestimated Mitigation largely ineffective What to do not obvious even in hindsight
Japan spent lots of effort on national hazard map, but 2011 M 9.1 Tohoku, 1995 Kobe M 7.3 & others in areas mapped as low hazard In contrast: map assumed high hazard in Tokai “gap” Geller 2011
Detailed model of segments with 30 year probabilities Off Sanriku-oki North ~M8 0.2 to 10% Off Sanriku-oki Central ~M7.7 80 to 90% Assumption: No M > 8.2 Off Miyagi ~M7.5 > 90% Off Fukushima ~M7.4 7% Off Ibaraki ~M6.7 – M7.2 90% Sanriku to Boso M8.2 (plate boundary) 20% Sanriku to Boso M8.2 (Intraplate) 4-7% Expected Earthquake Sources 50 to 150 km segments M7.5 to 8.2 (Headquarters for Earthquake Research Promotion) J. Mori
Giant earthquake broke five segments 2011 Tohoku Earthquake 450 km long fault, M 9.1 Expected Earthquake Sources 50 to 150 km segments M7.5 to 8.2 (Headquarters for Earthquake Research Promotion) (Aftershock map from USGS) J. Mori
Planning assumed maximum magnitude 8 Seawalls 5-10 m high Stein & Okal, 2011 NYT Tsunami runup approximately twice fault slip (Plafker, Okal & Synolakis 2004) M9 generated much larger tsunami CNN
Didn’t consider historical record of large tsunamis NYT 4/20/11
Lack of M9s in record seemed consistent with model that M9s only occur where lithosphere younger than 80 Myr subducts faster than 50 mm/yr (Ruff and Kanamori, 1980) Disproved by Sumatra 2004 M9.3 and dataset reanalysis (Stein & Okal, 2007) Short record at most SZs didn’t include rarer, larger multisegment ruptures Stein & Okal, 2011
Expensive seawalls - longer than Great Wall of China -proved ineffective 180/300 km swept away or destroyed In some cases discouraged evacuation NY Times 3/31/2011
Similar problems occur worldwide Many destructive earthquakes - including 2010 Haiti and 2008 Wenchuan (China) events - occurred in areas predicted to be relatively safe. Shaking in large earthquakes is often significantly higher than predicted (Kossobokov and Nekrasova, 2012) and so causes many more fatalities than expected (Wyss et al., 2012).
“What can we, and should we do, in face of uncertainty? Some say we should rather spend our resources on the present imminent problems instead of wasting them on things whose results are uncertain. Others say that we should prepare for future unknown disasters precisely because they are uncertain”. Hajime Hori, Emeritus professor of economics, Tohoku University
Too expensive to rebuild for 2011 sized tsunami Political decision to rebuild seawalls ~ as they were “In 30 years there might be nothing left there but fancy breakwaters and empty houses.” NY Times 11/2/2011
Could a similar megatsunami - much bigger than planned for at present -strike further south? No evidence of such events in past here No tectonic reason why not How likely? What to do? Cyranoski, 2012
"the question is whether the bureaucratic instinct to avoid any risk of future criticism by presenting the worst case scenario is really helpful… What can (or should be) done? Thirty meter seawalls do not seem to be the answer.” Forbes 4/2/2012
How to formulate rational policy? Because defending against natural hazards is similar to defending against human enemies, we consider an approach like that introduced by R. McNamara, Secretary of Defense, in 1960’s to formulate budget to address possible threats. Multidisciplinary systems analysis approach “is a reasoned approach to highly complicated problems of choice in a context characterized by much uncertainty; it provides a way to deal with different values and judgments …It is not physics, engineering, mathematics, economics, political science, statistics…yet it involves elements of all these disciplines. It is much more a frame of mind” (Enthoven and Smith, 1971).
Systems Analysis What’s the problem? What do we know & not know? What are we trying to accomplish? What strategies are available? What are the costs & benefits of each? What is an optimum strategy given uncertainty? In hazard mitigation, as in defense, our goal is to decide how much is enough.
Example: how large must U.S. nuclear force be to deter U.S.S.R. nuclear attack? Criterion: inflict unacceptable damage even after attack Costs of exceeding 400 Mt offer little benefit Enthoven and Smith, 1971
Two simple models illustrate this approach • Use stochasticmodel to select an optimum mitigation strategy against future tsunamis • 2) Use deterministicmodel that does not require estimating essentially unknown probabilities, to consider whether new nuclear power plants should be built. • These models can be generalized to mitigation policy situations involving other natural hazards.
Stochastic model Optimal level of mitigation minimizes total cost = sum of mitigation cost + expected loss Expected loss = ∑ (loss in ith expected event x assumed probability of that event) For tsunami, mitigation level is seawall height or other index Loss depends on tsunami height & mitigation level Less mitigation decreases construction costs but increases expected loss and thus total cost More mitigation gives less expected loss but higher total cost Stein & Stein, 2012
Including risk aversion & uncertainty Consider marginal costs C’(n) & benefits Q’(n) (derivatives) More mitigation costs more But reduces loss Optimum is where marginal curves are equal, n* Benefit (loss reduction) cost Stein & Stein, 2012 Uncertainty in hazard model & mitigation efficiency causes uncertainty in expected loss. We are risk averse, so add risk term R(n) proportional to uncertainty in loss, yielding higher mitigation level n** Crucial to understand hazard model uncertainty
Similar approach for earthquake – predict shaking in future earthquakes for different assumed magnitudes & ground motion models Stein et al, 2012 Newman et al, 2001
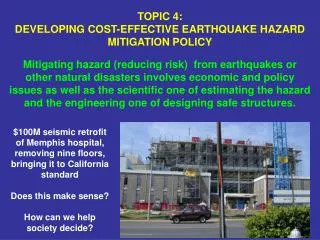
For assumed magnitude, ground shaking model, and mitigation level can estimate loss This case 10-100 fatalities ~ $100B damage Examine range of parameters & use to find optimum http://earthquake.usgs.gov/earthquakes/eqarchives/poster/2011/20110516.php
Problem - as Kanamori (2011) notes in discussing why "the 2011 Tohoku earthquake caught most seismologists by surprise” "even if we understand how such a big earthquake can happen, because of the nature of the process involved we cannot make definitive statements about when it will happen, or how large it could be.” What strategy to adopt if we can’t usefully estimate probability or bounds are too large?
The destruction of the Fukushima nuclear power plant prompted intense debate in Japan about whether to continue using nuclear power • Clear economic benefits to using nuclear power rather than more expensive alternatives. • Obvious danger in operating nuclear plants in nation with widespread earthquake and tsunami risks. NYT 9/19/2012
How to balance optimally the costs and benefits of building nuclear plants? The challenge in comparing the costs and benefits is the uncertainty in estimating the probability of great earthquakes and megatsunamis. This is difficult for the Tohoku coast. We know even less to the south along the Nankai coast, where we have no modern, historical, or geologic observations of mega-tsunamis, but the Tohoku tsunami suggests that they might occur. Because the stochastic model requires probability estimates, we consider an alternative deterministic model based on ones used in mathematical finance.
Benefits and costs Investing capital k in nuclear plant causes real income (GDP) X(t), to grow at rate (1/X(t)) dX(t)/dt = (b – r – vs)k (b – r) is the return on capital b less interest rate r Growth is reduced by “shocks” – losses due to large earthquakes or tsunamis – parameterized by s, times vulnerability factor v. Over time, log X(t) = log X(0) + [( b – r – vs)k] t
Even if we can’t estimate probability of “shocks”, we knowthe larger shocks are rarer. We thus estimate the “expected” or ”risk adjusted” growth using a “likelihood” term reflecting the relative risk of shocks q(s) = exp [(1/2)s2] The expected real GDP is the product z = qX. Z = log z = [(b – r – vs)k] + (1/2)s2
Our min/max strategy to determine the optimum investment in nuclear plants has two stages. • Min: Find the worst “expectation” or “likelihood” of the loss due to shocks. This is not the actual worst outcome (which is very unlikely), but the likely or expected worst outcome. s* = vk Z(s*)=(b-r)k – (vk)2 Loss from shocks depends on k, the capital invested, and vulnerability v Stein & Stein, 2012
2) Max: Determine a scale of nuclear plant investment that maximizes the minimum expected real income. k* = (b – r)/v2 Optimum inversely proportional to vulnerability squared Spend less in more vulnerable areas Stein & Stein, 2012 This two-stage approach gives the optimum conditional on the expected worst outcome. In other words, given the harm that nature is most likely to do, this is the optimal investment.
Model thoughts The approaches shown illustrate some ways to formulate strategies to defend society against hazards, given the uncertainty involved in estimating the probability and effects of the rarest and most damaging events. Both stochastic & deterministic models are schematic in illustrating approaches, rather than implementations. One simplification is that they focus on property losses and do not explicitly address life safety. For tsunamis, life safety is better addressed by warning systems that allow evacuations. The nuclear plant example implicitly includes life safety in the indirect costs of a disaster.
Similar analyses could be used for other hazards including river flooding and hurricanes (e.g. whether New Orleans defenses should be rebuilt to withstand only a Katrina-sized storm or larger ones) and to explore policies to mitigate the effects of global warming by considering the range of possible effects including the increased threat to coastal communities from hurricanes and rising sea level. Rise in global temperature by 2099 predicted by various climate models. For various scenarios of carbon emissions, (e.g., B1) the vertical band shows the predicted warming (IPCC, 2007).
Implications for math/geo initiative Natural hazards have enormous societal relevance Lots of interest among research community & students Recent events illustrate the difficulty in assessing and mitigating natural hazards due to rare extreme events whose probabilities are poorly known and hard to estimate They pose a wide range of major interdisciplinary intellectual challenges in geoscience and mathematical/statistical sciences, but progress can be made Natural hazards are one of the logical areas to request research & educational (IGERT?) funds, and would be one of the ideal foci for an institute/summer school, etc