Process Strategy
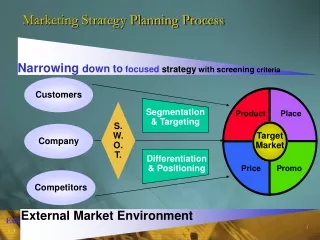
Process Strategy. Overview. Manufacturing process strategies Service process strategies Process Analysis And Design Flow charts Service system mapping Time-Function Mapping Value Stream Mapping Process Charts Service Blueprinting. Announcements. We will not cover all of chapter 7.


Process Strategy
E N D
Presentation Transcript
Overview • Manufacturing process strategies • Service process strategies • Process Analysis And Design • Flow charts • Service system mapping • Time-Function Mapping • Value Stream Mapping • Process Charts • Service Blueprinting
Announcements • We will not cover all of chapter 7. • We will concentrate on pp. 254-270 8th edition pp. 253-271 9th edition
Volume Manufacturing Process Strategies Low Volume High Volume Process Focus job shops (machine, print, carpentry) Standard Register Mass Customization Dell High Variety Repetitive (autos, motorcycles) Harley Davidson Poor Strategy (Both fixed and variable costs are high) Product Focus (commercial baked goods, steel, glass) Nucor Steel Low Variety
Comparison of process strategies Also See Table 7.2
Continuum Process Strategies King Sooper’s Video Buzz Group • A continuum • Within a given facility, several or blend of strategies may be used • These strategies are often classified as: Process-Focused Repetitive-Focused Product-Focused Batch Assembly Continuous Job Shop
Soft Drinks (Continuous, then Discrete) Light Bulbs (Discrete) © 1995 Corel Corp. © 1995 Corel Corp. © 1984-1994 T/Maker Co. Paper (Continuous) Product-Focused Examples
Product-Focused Strategy - Characteristics • Positive • Lower variable cost per unit • Lower but more specialized labor skills • Easier production planning and control • Higher equipment utilization (70% to 90%) • Negative • Lower product flexibility • More specialized equipment • Usually higher capital investment
Clothes Dryer Truck © 1995 Corel Corp. © 1995 Corel Corp. Repetitive-Focused Strategy - Examples
Repetitive Focused Strategy • Assembly line / Production line • Facilities often organized by assembly lines • Characterized by modules • Parts & assemblies made previously • Modules combined for many output options
Machine Shop © 1995 Corel Corp. Process-Focused Strategy Examples
Process Focused Strategy -Characteristics • Positives • Greater product flexibility • More general purpose equipment • Lower initial capital investment • Negatives • More highly trained personnel • More difficult production planning & control • Low equipment utilization (5% to 25%)
Customization at high Process - focused Volume High Job Shops Mass Customization (Print shop, emergency (Dell Computer’s PC) room , machine shop, Repetitive (modular) fine dining focus Variety of Products Assembly line (Cars, appliances, TVs, Moderate fast - food restaurants) Product - focused Continuous (steel, beer, paper, bread) Low Low Moderate High Volume Manufacturing Process Design
Comparison of process strategies Also See Table 7.2
Comparison of process strategies Also See Table 7.2
Mass Customization • Using technology and imagination to rapidly mass-produce products that cater to sundry unique customer desires. • Goal: • Variety of a job shop • Volume and variable cost of continuous production
Top 10 Mass Customization Companies in 2007 • # Mymuesli: Mass Customized Müsli • # Blends For Friends: Mass Customized Teas • # Vuru – Custom nutrition • # My Twinn - custom dolls • # Miss-Information: Custom travel books • # flattenme: Personalized children books • # TasteBook: Mass Customized recipes • # Paragon Lake: mass customized jewelry • # Cosmocards - Personal Greeting Cards • # Zyrra – mass customized bras
How do we determine which process strategy is best? • Process Crossover Point is one dimension that is considered. • Considers Volume/Cost trade-off
Process Crossover PointAt Voodoo Holds • The new machine would automate this process, reducing the labor involved. • The machine would cost $15,000. • However, labor cost would decrease from $20 per mold to $5 per mold.
Degree of Customization High Low Mass Service Professional Service Private banking Commercial banking High General- purpose law firms Full-service stockbroker Boutiques Retailing Degree of Labor Service Factory Service Shop Law clinics Specialized hospitals Limited-service stockbroker Warehouse and catalog stores Fine-dining restaurants Fast food restaurants Low Hospitals Airlines No frills airlines Service Process Matrix
Degree of Customization High Low Mass Service Professional Service High Degree of Labor Service Factory Service Shop Low Service Process Matrix Doctors Lawyers Accountants Architects Retailing Wholesaling Schools Commercial banking Airlines Trucking Hotels Hospitals Auto repair Other repair services
Degree of Customization High Low Mass Service Professional Service High Degree of Labor Service Factory Service Shop Low Service Process Matrix Doctors Lawyers Accountants Architects Retailing Wholesaling Schools Commercial banking Where does Zipcar Fit? Airlines Trucking Hotels Hospitals Auto repair Other repair services
Degree of Customization High Low High Professional Service Mass Service Degree of Labor Service Factory Service Shop Low Service Process Matrix • Challengers for Managers in High labor intensity services: • Hiring, training • Methods development • Employee welfare • Scheduling workforces • Control of far-flung locations • Managing growth
Degree of Customization High Low High Professional Service Mass Service Degree of Labor Service Factory Service Shop Low Service Process Matrix • Challengers for Managers in Highly customized services: • Fighting cost increase • Maintaining quality • Reacting to consumer intervention in process • Managing flat hierarchy with loose subordinates/superior relationships • Gaining employee loyalty
Degree of Customization High Low High Professional Service Mass Service Degree of Labor Service Factory Service Shop Low Service Process Matrix • Challengers for Managers in low labor services: • Capital decisions • Technological advances • Managing demand to avoid • Scheduling service delivery
Degree of Customization High Low High Professional Service Mass Service Degree of Labor Service Factory Service Shop Low Service Process Matrix • Challengers for Managers in Low customization services: • Marketing • Making service ‘warm’ • Attention to physical surroundings • Managing fairly rigid hierarchy with need for standard operating procedures
To summarize: • Products • Project • Job-shop process • Batch/assembly process • Continuous/line process • Mass customization • Services • Service Factory • Service Shop • Mass service • Professional service
Outputs Process Inputs The transformation model of a process What is a Business Process? Traditional Process definition in OM literature A process specifies the transformation of inputs to outputs • Different types of transformations • Physical (Ex. raw material finished product) • Locational (Ex. flying from Denver to L.A.) • Transactional (Ex. depositing money in a bank) • Informational (Ex. accounting data financial statement)
Resources Process Customers Suppliers Inputs Outputs What is a Business Process? A more comprehensive process definition A business process is a network of connected activities and buffers with well defined boundaries and precedence relationships, which utilize resources to transform inputs into outputs with the purpose of satisfying customer requirements
Illustration: Process Types and Hierarchies CEO Marketing Operations Accounting Buying a TV commercial Order Fulfilled Production planning Order Request Individual process Vertical process Horizontal process
Understanding the Existing Process • Questions to answer • What is the existing process doing? • How well does it perform? • What are the critical issues that impact the process performance? • Important to understand the process but do not overanalyze it in order to avoid “analysis paralysis” • Becoming so familiar with the process it is impossible to think of new ways of doing it
Understanding the Existing Process • Describe the process architecture • Inputs/outputs • Flow units • Resources • Network activities and buffers • Information system • Identify the process owner/stakeholders • Understand the customer
Describe the process architecture • Inputs and Outputs • Identify the process boundaries easy to identify the Inputconsumed from the environment in order to produce the desired Output • Process inputs and outputs can be • Tangible (Ex. raw material, cash, products, customers) • Intangible (Ex. Information, time, energy, services)
Describe the process architecture Flow units • A flow unit is a transient entity or a job that proceeds through the network of activities and buffers and exits the process as a finished output • Typically, the identity of a flow unit changes across the process • Examples of common flow units: materials, orders, files, documents, customers, products, cash, transactions…
Describe the process architecture • Transformational activities • The work performed on a job moving through a process can be divided into an ordered sequence of activities • The buffers represent storage or waiting points where the job waits before moving to the next activity (queues, waiting rooms, etc.) • Different types of jobs different paths through the network
Describe the process architecture • Resources • Tangible assets utilized to perform activities in a process • Can be divided into: • Capital assets – real estate, machinery, equipment, IT systems… • Labor – people and their knowledge and skills • Resources are utilized while inputs are consumed Note difference!!
Describe the process architecture • Information structure • Specifies the information required for making decisions and performing activities in a process • Limited information availability is a common cause for process inefficiencies • Information enables coordination! Airport Buzz Group
Process Analysis Tools • Flowcharts provide a view of the big picture • Time-function mapping adds rigor and a time element • Value stream analysis extends to customers and suppliers • Process charts show detail • Service blueprint focuses on customer interaction
Flow Charts • One of the fundamental graphical tools for process analysis and design • Typically depicts activities sequentially from left to right • Can help to identify, loops, multiple alternative paths, decision points etc. • Symbols to use in flow charting Transportation of a physical item Operation Storage Inspection Transportation of information Delay
Order waits for sales rep. Operator takes phone order. Orders wait to be picked up. Orders wait for supervisor. No Is order complete? Orders are moved to supervisor’s in-box. Supervisor inspects orders. Yes Order is fulfilled. Illustration of a Sample Flow Chart
Existing claims process for auto glass • Client notifies a local agent that she wishes to file a claim. She is given a claims form and is told to obtain a cost estimate from a local glass vendor. • When the claims form is completed the local agent verifies the information and forwards the claim to a regional processing center. • The processing center logs the date and time of the claim’s arrival. The data is entered into a computer-based system (for record keeping only) by a clerk. The claim is then placed in a hard copy file and passed on to a claims representative. • a) If the claims representative is satisfied with the claim it is passed along to several others in the processing chain and eventually a check is issued and sent to the client. • b) If there are problems with the claim the representative mails it back to the client for necessary corrections. • 5. When the client receives the check she can go to the local glass vendor and replace the glass.
Flow Chart of Auto glass insurance claims process 10. Attach Form 4. Is Claim Form correct? 11. Mail to customer 9. Problems with Claim? 10 11 9 4 3 5 6 12 13 14 15 1 2 7 8 1. Client notifies local agent and is given Claim Form 3. Agent verifies accuracy of Claim Form 6. Processing enters date, time and contents into computer and creates hardcopy 8. Routed to a Claims Rep. 13. Issue check to customer 15. Have glass repaired at local vendor 2. Client obtains estimate and completes Claim Form 5. Form forwarded to Regional Processing Center 7. Routed to a Claims Rep. 12. Route to Accounts Payable 14. Mail check to customer
Service System Mapping (I) • An extension of traditional flowcharting • Documents the role played by the customer in the service delivery process • A combination of service blue printing and traditional flowcharting • Build consistent perceptions of customer’s experience with core processes • Identify all points of contact between the process and its customers • Identify opportunities within the process
Service System Mapping • SSM Horizontal Bands • The purpose is to organize activities according to the people or “players in the process. – Who does what? • An SSM typically consists of 5 bands • Customer band – end user • Frontline or distribution channel band • Back-room activity band • Centralized support or information systems band • Vendor or supplier band
Authors send manuscripts to the Journal Editorial Office (JEO). JEO sends a letter of acknowledgement and sends manuscript to editor-in-chief (EIC) EIC selects associate editor (AE) to handle manuscript and notifies JEO JEO sends manuscript to AI AE reads manuscript and selects 2 referees. AE notifies JEO. JEO sends copies to referees Referees review and send reports to JEO. JEO forwards reports to AE AE reads reports and decides reject, accept, revise. Decision sent to JEO. If rejected, JEO sends letter to authors. If accepted, JEO forward manuscript to production. JEO notifies authors and EIC. If revise, JEO forwards reports to authors. Authors revise and resubmit to JEO. JEO sends resubmit to AE AE decides accept or 2nd review SSM Journal Paper Submissions
1 13 Author Acknowledge Revision 2 4 6 8 10 14 JEO 3 Accepted Further reviewing EIC 5 9 15 AE Accepted 7 Referees Production SSM Journal Paper Submissions
Customer Sales Production control Plant A Extrude Order product Process order Wait Wait Wait Wait Print Warehouse Move Move Receive product Plant B Transport 12 days 13 days 1 day 4 days 1 day 10 days 1 day 0 day 1 day 52 days Time-Function Mapping or Process Mapping Figure 7.7
Order product Receive product Customer Process order Sales Production control Wait Print Plant Wait Warehouse Extrude Transport Move 1 day 2 days 1 day 1 day 1 day 6 days Time-Function Mapping or Process Mapping Figure 7.7