Download
1 / 23
230 likes | 325 Vues
Explore long-run demand elasticities for petroleum products in OPEC countries, focusing on Saudi Arabia for valuable insights. Analyze the impacts of oil prices, economic activity, and population composition on consumption patterns. Discover strategies for sustainable economic growth amid fluctuations.

E N D
Measuring Long-Run Demand Elasticities for Petroleum Products in OPEC Carol A. Dahl, Professor, Mineral and Energy Economics Program, Colorado School of Mines, Golden Colorado, USA and Visiting Professor, Department of Economics, King Saud University and AfafA. Abaalkhail, Lecturer, Department of Economics, College of Business Administration, King Saud University, Riyadh, Saudi Arabia,
Coming Attractions: • Global Growth in Oil Products compared to OPEC • Only Asia Pacific has grown faster • Compare model types • Talk about scope of project • time periods • products • countries • Issues from initial analysis • Some observations on Saudi Arabia
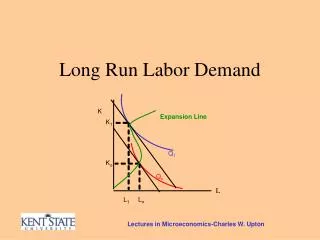
ModelsCharemza and Deadman (1997) • Where O =the consumption of the oil product • P =the price of the energy product • Y = some measure of economic activity such as GDP • t = an indice for the observation, which is time in a time series estimate • t – 1 = the variable last period
Scope of Project • 1980-2009 • Gasoline, Kerosene, Diesel, Residual • Total Oil Products • Countries • Algeria, Angola, Ecuador, Indonesia, Iran, Kuwait, • Libya, Nigeria, Qatar, UAE, Venezuela • Today talk about project in context of Saudi Arabia
Saudi Arabia Battling Russia for the Lead(Source: BP Statistics)
Oil's Importance to Saudi Arabia (2009)(Source: Saudia Arabian Monetary Authority) • >80% of merchandise exports • >80% of government revenues • >15% of gross fixed capital formation • ~1/4 Gross Domestic Product (GDP)
Issues to Consider • Measure of income? • GDP erratic from oil cycles • permanent income • non oil income • Population composition? • women joining labor force • guest workers • What price? • What currency? • local • PPP better than exchange rates
Gasoline 1980-2009 • 1. LnQ/Pop = β1 + β2LnP + β3LnY/Pop • 2. LnQ = β1 + β2LnP + β3LnY • 1. Dep=ln(G/Pop) Coefficient t-Statistic • C -0.657 -0.715 • Pg -0.199 -3.654 • Y/Pop -0.704 -4.043 • R2 = 0.39 • 2. Dep=ln(G) Coefficient t-Statistic • C -6.947 -7.678 • Pg 0.173 2.690 • Y 1.486 9.639 • R2 = 0.810
Gasoline 1981-2009 (LE) • 3. LnQ = β1 + β2LnP + β3LnY + β4LnE-1 • 3. Dep = Ln(G) Coefficient t Statistic LR • C -1.050 -3.051 • Pg-0.045 -2.820 -0.33 • Y 0.240 3.507 1.84 • G-1 0.887 19.557 • R2 = 0.996
Kerosene 1980-2009 • 1. LnQ/Pop = β1 + β2LnP + β3LnY/Pop • 2. LnQ = β1 + β2LnP + β3LnY • 1. Dep=ln(K/Pop) Coefficient t-Statistic • C 1.932 3.510 • Pk-0.001 0.249 • Y/Pop -2.019 0.005 • R Square =0.452 • 2. Dep=ln(K) Coefficient t -Statistic • C -12.305 -5.253 • Pk 0.667 3.234 • Y 2.108 5.157 • R Square= 0.671
Kerosene LE 1981-2009~3/4 domestic jet, ~1/4 residential • 3. LnK= β1 + β2LnP + β3LnY + β4LnK-1 • 3. Dep = Ln(K) Coefficient t StatisticLR • C -0.586-0.333 • Pk -0.068 -0.542 -0.56 • Y 0.155 0.512 1.27 • K-1 0.878 8.543
Diesel/Gasoil (1980-2009)~ 50% Electricity and Industry, Transport 50% • 1. LnQ/Pop = β1 + β2LnP + β3LnY/Pop • 2. LnQ = β1 + β2LnP + β3LnY • 1. Dep=ln(D/Pop) Coefficient t-Statistic • C -0.719 -2.459 • Pd -0.151 -3.951 • Y/Pop -0.423 -3.083 • R Square = 0.605 • 2. Dep=ln(D)Coefficient t -Statistic • C 4.785 -5.31 • Pd 0.126 2.183 • Y 1.185 7.617 • R Square = 0.761
Diesel/Gasoil (1981-2009) • 3. LnQ = β1 + β2LnP + β3LnY + β4LnE-1 • 3. Dep = Ln(D) Coefficient t StatisticLR • C -1.323 -3.462 • Pd -0.038 -1.951 -0.176 • Y 0.327 3.908 1.498 • D-1 0.782 12.505
Residual (Heavy) Fuel Oil (1981-2006) • 1. LnQ/Pop = β1 + β2LnP + β3LnY/Pop • 2. LnQ = β1 + β2LnP + β3LnY • 1. Dep=ln(R/Pop) Coefficient t-Statistic • C-8.361 -1.954 • P r -0.178 -0.546 • Y/Pop 1.076 1.333 • R-squared 0.326
Heavy Fuel Oil (1981-2006) • 3. LnR= β1 + β2LnP + β3LnY + β4LnR-1 • 3. Dep = Ln(R) Coefficient t StatisticLR • C -0.788-0.707 • Pr -0.126 -1.399 -1.07 • Y 0.210 1.166 1.78 • R-1 0.882 8.908
Sum Up • Preliminary Work Suggest Some Interesting Issues • At least in Gulf • Oil GDP is erratic • Composition of population should be investigated • Which price • may not matter at very low prices