Download
1 / 15
150 likes | 322 Vues
Market structures – market and concentrated. Unit 2. Different Kinds of Market Structures. We will examine four market structures: Competitive Perfect Competition Monopolistic Competition Concentrated Oligopoly Monopoly. Perfect Competition.

E N D
Different Kinds of Market Structures • We will examine four market structures: • Competitive • Perfect Competition • Monopolistic Competition • Concentrated • Oligopoly • Monopoly
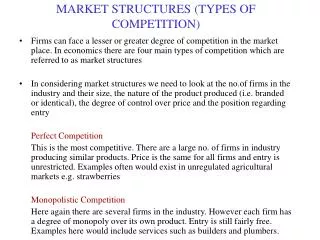
Perfect Competition • Perfect competition is the most competitive market structure possible. It is characterized by the following:a) there are many small firms, b) it is easy for new firms to enter and, c) all firms sell identical products.
All Firms selling the exact, identical product?? Fruit and Vegetables are the same • - very rare scenario where the product is identical • - producers are forced to sell at the same price as the other producers or all of them will lose money
Perfectly Competitive Market • Joe can sell as many strawberries as he can produce at the price of $1. • If he tries to raise his price, his sales will drop to zero as the consumers have many competitors to buy from. • This is a perfectly elastic demand curve.
Producers in a Perfectly Competitive Market • For producers in a perfectly competitive market, they must: • Reduce production costs per unit as much as possible (i.e., maximize production efficiency), • Maximize production as much as is economical, • Sell at the price the market determines (a price taker). • The level of competition will mean that the profit level will be low and many firms will go bankrupt or be struggling to survive.
Keeping costs down • To survive in a perfectly competitive market a firm must maximize efficiency and minimize production costs per unit produced. • To understand how producers have to keep prices low, you have to learn a little bit of ACCOUNTING AAAAAAAHHHHHH!!!!!
FIXED Costs • Fixed costs refer to costs that a firm must pay regardless of how many products are produced. • If a firm owns a factory then they will pay property taxes and heating costs for the building irrespective of the amount of goods and services that are being produced. • The fewer products that are produced the greater the average fixed cost per unit will be.
Example – Average Fixed Costs • A firm pays $1000 property tax on a factory. • If their factory produces only one product then the average fixed property tax cost per unit produced is $1000, or very high. • If the factory produces 100 units, then the average fixed property tax cost per unit produced is $10, or much lower. This relationship can be displayed graphically.
Variable Costs • Variable costs are those costs (e.g., labour and raw materials) which increase as production output increases.Labour costs depend on the salary of the individual workers and their level of output. • Any factory, or other production facility, will have a certain optimum production capability. • Optimum production will be achieved with a specific number of workers. • If there are fewer workers, they will be overworked and therefore prone to errors and reduced productivity. If there are too many workers, they will be underutilized and therefore inefficient.
Law of Diminishing Returns • This graph reflects the following data that demonstrates that as workers are added to a production, facility production per worker increases to an optimum number of workers, in this case six. • Once the optimum level is reached, adding additional workers leads to a decline in average output per worker as each worker adds fewer and fewer additional products. • This phenomenon is called the law of diminishing returns. • For example, if additional units of one productive input are combined with a fixed quantity of another productive input, the average output per unit will increase at first and then decline.
Marginal productivity • The fact that each additional worker is adding fewer products to the overall output is an important statistic. • Marginal productivity is the number of additional products produced for one new worker added.
So what's the big deal? • Marginal productivity will be important for producers because hiring additional workers is expensive and beyond a certain point the production gained by hiring another worker is not worth the expense.