
Modeling Particle Trajectories in Ultrasonic Standing Waves for Efficient Separation Processes
This study explores the impact of acoustic radiation forces on particles within ultrasonic standing waves, specifically for applications in particle separation, fractionation, and agglomeration. By assessing the forces acting on particles in an acoustic field, we can predict their movement and optimize separation efficiency. Utilizing a microfluidic ultrasonic separator as a case study, we present numerical methods for modeling particle trajectories and concentrations, considering various operational parameters and demonstrating the effectiveness of our approach through experimental validation.

Modeling Particle Trajectories in Ultrasonic Standing Waves for Efficient Separation Processes
E N D
Presentation Transcript
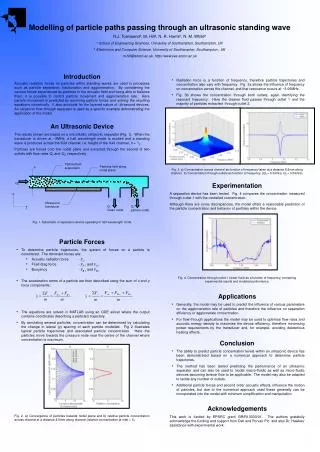
Particle/fluid suspension Particles held along nodal plane h Q0 Ultrasound transducer y Q1 Clean outlet Q2 particle outlet x Modelling of particle paths passing through an ultrasonic standing wave R.J. Townsenda, M. Hilla, N. R. Harrisb, N. M. Whiteb a School of Engineering Sciences, University of Southampton, Southampton, UK b Electronics and Computer Science, University of Southampton, Southampton , UK m.hill@soton.ac.uk, http://www.ses.soton.ac.uk • Introduction • Acoustic radiation forces on particles within standing waves are used in processes such as particle separation, fractionation and agglomeration. By considering the various forces experienced by particles in the acoustic field and being able to balance them, it is possible to control particle movement and agglomeration rate. Here particle movement is predicted by summing particle forces and solving the resulting equations numerically. It also accounts for the layered nature of ultrasound devices. An ultrasonic flow-through separator is used as a specific example demonstrating the application of the model. • An Ultrasonic Device • The results shown are based on a microfluidic ultrasonic separator (Fig. 1). When the transducer is driven at ~3MHz, a half wavelength mode is excited and a standing wave is produced across the fluid channel, i.e. height of the fluid channel, h = /2. • Particles are forced onto the nodal plane and extracted through the second of two outlets with flow rates Q1 and Q2, respectively. • Fig. 1. Schematic of separation device operating in half wavelength mode • Particle Forces • To determine particle trajectories, the system of forces on a particle is considered. The dominant forces are: • Acoustic radiation force - Fac • Fluid drag force - FD x and FD y • Buoyancy - FB x and FB y • The acceleration terms of a particle are then described using the sum of x and y force components: • The equations are solved in MATLAB using an ODE solver where the output contains coordinates describing a particle’s trajectory. • By simulating several particles, concentration can be determined by calculating the change in lateral (y) spacing of each particle modelled. Fig 2 illustrates typical particle trajectories and associated particle concentration. Here the particles move towards the pressure node near the centre of the channel where concentration is maximum. • Fig. 2. a) Convergence of particles towards nodal plane and b) relative particle concentration across channel at a distance 8.5mm along channel (relative concentration at inlet = 1). • Radiation force is a function of frequency, therefore particle trajectories and concentration also vary with frequency. Fig. 3a shows the influence of frequency on concentration across the channel, and that resonance occurs at ~3.06MHz. • Fig. 3b shows the concentration through both outlets, again identifying the resonant frequency. Here the cleaner fluid passes through outlet 1 and the majority of particles extracted through outlet 2. • a) b) • Fig. 3. a) Concentration across channel as function of frequency taken at a distance 8.5mm along channel. b) Concentration through outlets as function of frequency, (Q1 = 0.04ml/s, Q2 = 0.06ml/s). • Experimentation • A separation device has been tested. Fig. 4 compares the concentration measured through outlet 1 with the modelled concentration. • Although there are some discrepancies, the model offers a reasonable prediction of the particle concentration and behavior of particles within the device. • Fig. 4. Concentration through outlet 1 (clean fluid) as a function of frequency, comparing experimental results and modeled performance. • Applications • Generally, the model may be used to predict the influence of various parameters on the agglomeration rate of particles and therefore the influence on separation efficiency or agglomerate concentration. • For flow-through applications the model may be used to optimise flow rates and acoustic energy density to maximise the device efficiency, therefore minimising power requirements by the transducer and, for example, avoiding deleterious heating effects. • Conclusion • The ability to predict particle concentration levels within an ultrasonic device has been demonstrated based on a numerical approach to determine particle trajectories. • The method has been tested predicting the performance of an ultrasonic separator and can also be used to model macro-fluidic as well as micro-fluidic devices assuming laminar flow to be applicable. The model may also be adapted to tackle any number of outlets. • Additional particle forces and second order acoustic effects, influence the motion of particles, but due to the numerical approach used these generally can be incorporated into the model with minimum simplification and manipulation • Acknowledgements • This work is funded by EPSRC grant GR/R13333/01. The authors gratefully acknowledge the funding and support from Dstl and Porvair Plc. and also Dr, Hawkes’ assistance with experimental work.


