Download
1 / 9
140 likes | 585 Vues
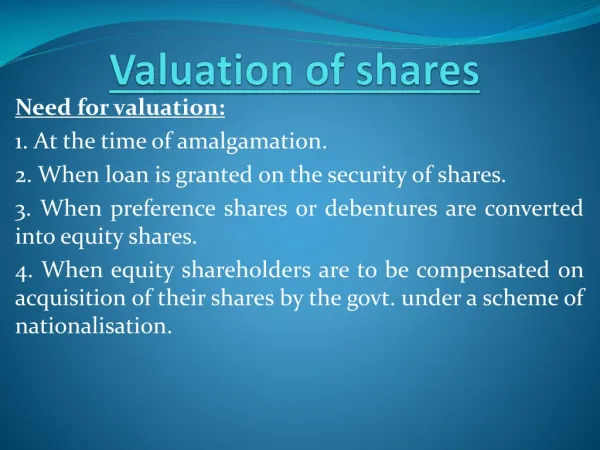
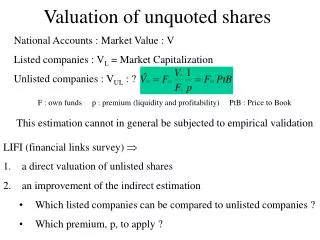
Valuation of unquoted shares. National Accounts : Market Value : V Listed companies : V L = Market Capitalization Unlisted companies : V UL : ? . F : own funds p : premium (liquidity and profitability) PtB : Price to Book.

E N D
Valuation of unquoted shares National Accounts : Market Value : V Listed companies : VL = Market Capitalization Unlisted companies : VUL : ? F : own funds p : premium (liquidity and profitability) PtB : Price to Book This estimation cannot in general be subjected to empirical validation • LIFI (financial links survey) • a direct valuation of unlisted shares • an improvement of the indirect estimation • Which listed companies can be compared to unlisted companies ? • Which premium, p, to apply ?
Validation of valuation by LIFI . VABIL: value of the stake recorded on the balance sheet (source LIFI) . TxC: rate of control given by this particular link (source LIFI) • Construction of the sample • Files of financial liaisons from 1994 to 1999 • Detection of the year of acquisition • acquisition value market value elimination of the newly created companies • Estimation possible for 16,000 listed and unlisted companies in the field (non financial firms) • For listed companies this valuation is an unbiased estimator of the capitalization
First results PtB : Price to Book F : own funds • PtB is decreasing with size (profitability) • PtB is higher for listed companies U – curve
Extension to all non-financial unlisted companies… Cluster constructed on the basis of threecriteria • Sum of fixed assets • Share of capital assets • Profitability … leads to an average PtB of 1.56 in 1999 The PtB applied in national accounts ranks from 1.33 in 1995 to 3.04 in 1999, a year of high market capitalization
In 1999 (in € billions) TYPE Number Equity Result Market PtB PER Profitability capital capitalisation % CAC 40 32 226 20 884 3.92 43.4 9.0 SBF 120 60 50 6 141 2.85 22.4 12.7 SBF 250 96 27 2 71 2.62 31.5 8.3 P & S 300 24 2 35 1.47 17.9 8.2 2 – Liquidity premiumWhich kind of listed companies ? Others 184 3 0 11 3.78 41.6 9.1 TOTAL 672 329 31 1,143 3.47 36.7 9.5 P&S : listed companies on the Primary and Secondary markets that do not figure in the SBF indices • PtB of P&S listed companies : • closer to that of the unlisted • less volatility than other listed
P&S listed companies • P&S companies have an average PtB close to that of unlisted companies but this is purely coincidental because of two opposite factors : • listed companies are bigger and profitability decreases with size • premium liquidity Companies with share of capital assets in total fixed assets <10%. PER’ = V/EBE REB=EBE/K Own funds bracket P&S : listed companies on the Primary and Secondary markets that do not figure in the SBF indices
The Price Earning Ratio (PER) Pr : Profit d : discount rate p : liquidity premium Profit : Bottom line (Résultat net comptable) in consolidated accounts Theorically : anticipated profits Practically : weighted average of past profits
Computation of the profits Profits in the individual accounts of the parent company ignore the reinvested profits of the subsidiaries DIV : Dividends Tx : Rate of financial control Pr : Profit BL : Bottom line This computed consolidated result is an unbiased estimator of the published consolidated result From : INSEE & COFISEM, 484 non financial listed companies, year = 1999 134 listed companies with no foreign affiliate
Results PER for unlisted companies is, controlled for other variables, 4 points below the PER for P&S This leads, for a PER of 16, to a liquidity premium of about 25% (4/16 = 25%)