High-Quality Maps with R and ggplot
Learn where to get data and shapefiles, how to geocode easily, and create visually appealing maps using R and ggplot. Discover the pros and cons, and why R is ideal for mapping. Find helpful benchmarks, data sources, LSOA and MSOA insights, shapefile explanations, geocoding tips, and enhancing output quality strategies. Dive into mapping effortlessly with R and ggplot!

High-Quality Maps with R and ggplot
E N D
Presentation Transcript
High Quality Maps With R and ggplot Simon Hailstone
What am I here to Talk About? • Where to get data to map • Where to get shapefiles • How to geocode the easy way • How to combine all of this in ggplot • Pros and Cons
Why Use R for Maps? • Business Objects Reporting System Limited charting capabilities and no maps! • R can be used to run through chunks of data and generate image files • R can dynamically name the files it creates • Business Objects can then concatenate hyperlinks together
The Benchmark http://flowingdata.com/2009/11/12/how-to-make-a-us-county-thematic-map-using-free-tools/
The Benchmark http://www.thisisthegreenroom.com/2009/choropleths-in-r/
Find Something Interesting • Lots of statistics in the UK are released with a geographic dimension • Plenty of examples over at data.london.gov.uk/datastore and also at the Office of National Statistics (ONS) • Look for the terms MSOA and LSOA! This allows really easy matching of data to UK geography
LSOA and MSOA • We are very lucky in the UK to have the ONS who maintain geographic sub-divisions of the country • The whole country is split into census output areas. These are then aggregated to form larger areas such as wards and regions. • LSOA and MSOA are common geographic areas for which statistics are released
Find Something Interesting • Ambulance Service Incidents from London datastore website • LSOA level dataset for a couple of interesting domains • Binge Drinking • Assault • Deprivation • Population • Also identified A&E departments and sizes to plot as reference points: http://www.england.nhs.uk/statistics
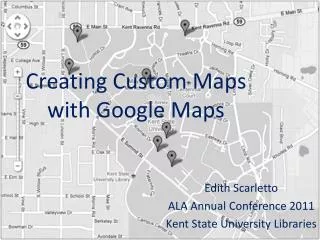
What is a shapefile? • Widely used file type for saving geographical features • Vector based: • Point • Polyline • Polygon
Where Can I get Shapefiles? • Once again, ONS to the rescue: geoportal.statistics.gov.uk
Where Can I get Shapefiles? • Ordnance Survey: http://www.ordnancesurvey.co.uk/business-and-government/products/opendata-products.html
Where Can I get Shapefiles? • Natural Earth: naturalearthdata.com
Where Can I get Shapefiles? • Open Streetmap: openstreetmap.org
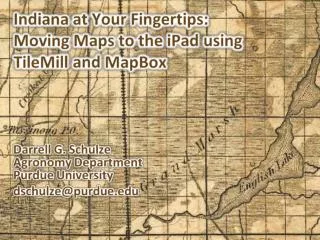
How do I get Shapefiles into R? • The maptools package provides the function readShapeSpatial which allows easy importing of shapefiles:readShapeSpatial("London_CCG.shp", IDvar="PCO12NM") • If your shapefiles are really complex try simplifying them using gSimplify in the rgeos package. • Simplifying shapefiles can give bad results so consider filtering to the bare minimum first!
Geocoding the Easy Way! • Geocoding is the act of adding geographic information to data. • In most cases this involves using postcodes to attach co-ordinates • This can be a bit of a pain • Large postcode tables (2.5 million records) • Inconsistent postcode formats in different systems • Maintenance: Need to keep postcode tables up to date • I don’t have postcodes for the A&E departments!
Geocoding the Easy Way! • Luckily R (with a little help from Google) makes it easy if you only have a small amount of data to geocode! • library("ggmap")AAE$Address<- paste0(AAE$Name,",LONDON,UK")geocode(AAE$Address)
Pulling things Together in GGPLOT • Before you can use a shapefile with ggplot, the fortify command needs to be used:fortify(msoa,region="MSOA04CD") • This converts a shapefile to a dataframe • This can be quite time consuming • keep the number of features as low as possible • simplify if it still takes a long time.
Pulling things Together in GGPLOT • ggplot works using layers which allows fine tuned control of a lot of graphical features • Shapefile polygons can be coloured based on data • Because of ggplot’s layering abilities, additional layers can be added: • CCG borders • A&E departments
Pulling things Together in GGPLOT • geom_polygon function is used to plot shapefiles • coord_map is used to set the projection of the map (mercator was used in this instance • theme_bwwas used to minimise additional graphical elements. Those remaining were removed using ggplot’s theme options: theme( legend.position="bottom", legend.title=element_blank(), legend.key = element_rect(linetype= 0), axis.text=element_blank(), axis.title=element_blank(), axis.ticks=element_blank(), panel.border=element_blank(), panel.grid=element_blank() )
Improving Output QUality • Important to use strokes in ggplot. • Shapes surrounded by a stroke line give a far superior graphical finish. • The Cairo package is also used to improve graphical output with anti-aliasing: • ggsave(file="Population.png", plot=p, width=200, height=200, units="mm", type ="cairo-png")
Output Quality • Default output!
Output Quality • With Cairo package:
Output Quality • With Cairo package and strokes added
Pros & Cons • Pros • The ususal! • Re-usable Automation • Shareable • Transparent code • Flexible • Precise control • Really nice output images! • Cons • Labels and text formatting in general • Processing time Not as fast as specialised GIS packages • Although much of the processing only needs to be done as a one off • Not as user friendly for single bits of analysis QGIS still wins here