Download
1 / 8
80 likes | 204 Vues
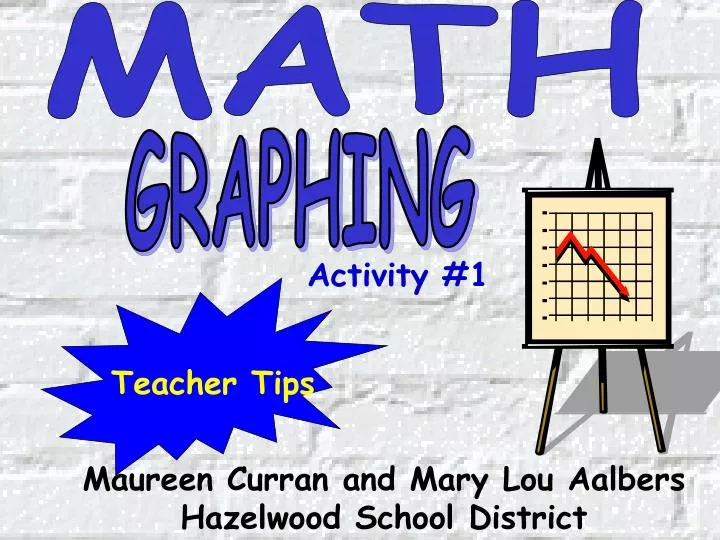
MATH. GRAPHING. Activity #1. Teacher Tips. Maureen Curran and Mary Lou Aalbers Hazelwood School District. GRAPHING. The following lessons are addressing these standards: Develop, analyze, and explain methods utilized to collect, organize, and describe data. (MO 1.1, 1.4,1.8, 2.1)

E N D
MATH GRAPHING Activity #1 Teacher Tips Maureen Curran and Mary Lou Aalbers Hazelwood School District
GRAPHING • The following lessons are addressing these standards: • Develop, analyze, and explain methods utilized to collect, organize, and describe data. (MO 1.1, 1.4,1.8, 2.1) • Investigate tree, Venn or student-developed diagrams as an organizing tools for problem solving. (MO 1.8, 2.1, 2.2)
Teacher Tips • You will need to click the mouse to show the answers for activities. This will allow you to control the timing of answers shown. • We suggest that students keep a journal. • It is critical for students to use writing skills to explain their answers. • Please take time to discuss possible solutions to problems. • Click to see answer on each slide and click to go to the next slide.
Now Presenting~ GRAPHING ACTIVITY #1
Number of Quarters GRAPH A GRAPH B Number of Minutes You are playing video games and have a pocket full of quarters. After playing for an hour, one of the graphs shows what happens to the quarters in the machine, and the other graph shows what happens to the quarters in your pocket.
Number of Quarters GRAPH A GRAPH B Number of Minutes THIS ONE Which graph shows the number of quarters in your pocket? GRAPH B
Number of Quarters GRAPH A GRAPH B THIS ONE Number of Minutes Which graph shows the number of quarters in the machine? GRAPH A
It’s PENCIL TIME!! In your journal, write down at least three different situations in real life that would show the same relationship as the quarters in your pocket and the quarters in the machine. Discuss and list all examples your class finds in your journal. End of Activity