Download
1 / 47
490 likes | 679 Vues
Unlocking the Potential in the Supply Chain through Lean Logistics. David Taylor Cardiff University. 2004 Queensland Supply Chain Seminar Brisbane 10 & 11 June. Agenda. Yesterday : The Background & Theory Lean Thinking v Mass Production Understanding Waste The Lean Principles

E N D
Unlocking the Potential in the Supply Chain through Lean Logistics David Taylor Cardiff University 2004 Queensland Supply Chain Seminar Brisbane 10 & 11 June
Agenda • Yesterday : The Background & Theory • Lean Thinking v Mass Production • Understanding Waste • The Lean Principles • Today : The Practice • Lean Tools & Techniques • Case Studies of Lean Applications & Benefits
Overproduction Defects Waiting MUDA Non-Value-Adding Activity Unnecessary motion Transport inventory Inappropriate Processing What have we Got So Far ? Mass Production Thinking V Lean Thinking The Five Lean Principles • Specify value • Identify the value stream • Make the product flow • So the customer can pull • Manage towards perfection The Seven Wastes
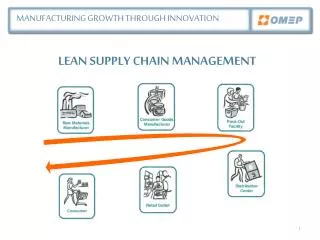
Value Stream Management The application of Lean Thinkingto improving business processes Lean Mapping ToolsLean Improvement Tools Lean Strategic Techniques
Total Value Stream Action Action Action Action Action Action Multi-plant Plant Action Value Streams VSM Can Be Applied at All Levels
Value Stream Management A Dis-Aggregated Approach It deals with individual value streams separately
Dis-Aggregation By Product Family Product Group A Product Group B Customer Product Group C Treat each product group as a separate Value Stream
Value StreamManagement Methodology • Select a key value stream for pilot lean improvement - Key Product to Key Customer • Situational Analysis - Using ‘Mapping Tools’ • Develop model lean value stream – Using Lean Improvement Tools • Roll out lean to other value streams
Value Stream Mapping ToolsLean Tools For Analysing the Current Situation & Identifying Waste • Process Activity Mapping • Current State Mapping • Demand Amplification Map • Quality Filter Map • Physical Structure map • Production Variety Funnel • Decision Point Analysis Create a Quantified Assessment of Process Performance
Process Activity Mapping • The starting point for value stream improvement • Go to the work place and record what actual happens • Don’t do it in the office where you record what you think is happening
Process Activity Map Summary Statistics Time Operations = 2 mins Inspection = 1 min Transport = 41 min Delay = 720 min Storage = 960 min Value Adding Operations Represent < 1% of Total time
Huck Fasteners : Birmingham • Lean Improvement initiative • Mapped a pilot value stream - Hucktainer • Recorded & measured every step in making a specific product • Produced photo sequence – as part of their internal lean education process
Huck Fasteners Performance Improvements from Lean • On-time delivery +10% • 40% Increase in V.A. per employee • 35% reduction in lead-times • 20% reduction in inventory • 40% of floor spaced freed - Cancelled £10m new factory • 55% reduction in set-ups Morethan offset 5% loss in margin due to foreign competition
Current State Mapping • A Toyota tool • A clear visual representation of a process • Links Physical Product Flow Information Flow Time • The first tool to do this !
Forecast Forecast ProcessorProductioncontrol Demand = x / wk Del’v Time= 4pm Pack size-=pallet Weekly Call In Daily Call In Despatch Butcher Primal Cut Slice & Pack C/T = 120 s. C/T = 150 sec. C/T = 200 s Information Flow I I VA = 60s VA = 30.sec VA = 35 s. Daily Farms Supermarket Daily Production Plan 1 shifts 1 shifts 1 shifts 300 pieces(1 Day) 600 pieces(2 Days) Daily 2% Wastage 4% Wastage 5% Waste Product Flow C/T = 120 s VA = 0s 2 shifts 1% Defects Total time = 72 hrs Value Added = 125 sec Time Time 48 hrs 24 hrs 60 sec 30 sec 35 sec Current State Map : Meat Processing Plant
Forecast Forecast ProcessorProductioncontrol Demand = x / wk Del’v Time= 4pm Pack size-=pallet Weekly Call In Daily Call In Unreliable delivery Inaccurate forecasts Slice & Pack Despatch Primal Cut Butcher C/T = 200 s C/T = 120 s. C/T = 150 sec. I I VA = 35 s. VA = 60s VA = 30.sec Daily Farms Supermarket Daily Production Plan 1 shifts 1 shifts 1 shifts 300 pieces(1 Day) 600 pieces(2 Days) Daily 5% Waste 2% Wastage 4% Wastage C/T = 120 s VA = 0s 2 shifts 1% Defects High defects rate Excessstock Unbalanced C/T Total time = 72 hrs Value Added = 125 sec Time 48 hrs 24 hrs 60 sec 30 sec 35 sec Identify Wastes & Problems
Flow system introduced ProcessorProductioncontrol Demand = x / wk Del’v Time= 4pm Pack size-=pallet Daily Call In Daily Call In Reduced Finished stock Primal Cut Butcher Despatch Slice & Pack C/T = 120 s. C/T = 120 sec. C/T = 120 s Balanced cycle times I I VA = 30 s. VA = 30.sec VA = 30s Daily Supermarket Daily Production Plan Farms 1 shifts 1 shifts 1 shifts 300 pieces(1 Days) 300 pieces(1 Day) Daily 1% Wastage 1% Wastage 1% Wastage C/T = 120 s VA = 0s 2 shifts 1% Defects Reduced rejects Total time = 48 hrs Value Added = 90 sec Time 24 hrs 24 hrs 30 sec 30 sec 30 sec Develop a Future State Map Reduced Total Time
‘SMART’ Action Plan Specific Measurable Achievable Resourced Timed)
Lean Principles to Guide Action Plan Lean Improvement Tools to Achieve The Value Stream ManagementOverview Current State Map Future State Map
Reduce Set up Times Lean layout Joint Demand Management Supplier Associations 5S Co-operate with customers Co-operate with Suppliers TPM Joint Inventory Management Network Sourcing Smaller Batches Demand smoothing Kanban Lean Tools for Improvement All help you to move towards Flow, Pull & Perfection
Lean Applied at the Cell Level Total Value Stream Action Action Action Action Cell Cell Multi-plant Plant Cell Lean Applied at the Plant Level
Lean Applied at the Cell Level Meat Processing : Slice & Pack Cell • Mapping identified problems & opportunities with this cell • Master Class to Improve the cell performance in Quality, Cost & Delivery • 8-day Structured Project Led by a Lean expert Involved cell operators & team leaders Pork loins Sliced to Chops Vacuum packed
Lean Applied at The Cell Level Meat Processing Company Slice & Pack Cell
Total Value Stream Action Action Action Action Cell Cell Multi-plant Plant Cell Lean Applied to the Whole Supply Chain
Company 2 Company 3 Company 1 Key Key Co 1 Data Data Production Control Customer Suppliers MRP Transport data Transport data Inventory Total lead time = 16 days V A time = 6 mins Quality OEE 4 days 1 day 5 d (2m) 4d (3m) 2d (1m) Extended Value Stream Maps Same structure Information links between companies Key Data by Firm Time for whole chain Transport Links
Create a Joint Value Stream Mapping & Improvement Team One or two senior manager from each company in the chain The Team then:- Jointly map all steps along the whole chain Jointly identify problems and opportunities Jointly develop a Future State Vision Jointly develop an Action plan
Current State Map : Whole Value Chain for Pork Farm / Processor / Retailer ForecastsAnnual /Qtrly /Weekly/ Daily (HQ) Marketing DeptMkt ResearchNew Prod IntroPackagingPricing Farm Product’n Manager HQPork Selector Procurement Manager (Processor) A/c Mgr Forecast pigs available Retail Link System Weekly pig requirement Forecasts New Prod Introduction 33 weeks Weekly actual available ? Daily sales data by store Weekly Requirementt by abattoir Farm Logistics Manager HQInforem System (Processor) Site Planning Weekly demand& capacity New Prod Introduction 2 months to 45 mths Daily order by RDC Group Planning Thursday meeting Daily order Farm Farm Managers (2) (Processor) DespatchControl Daily scheduleby product type HQSupply Mgr StoreMeat Mgr Forecast Tue & Thur 7 day rolling & Seasonality trends Daily despatch schedule Daily epos data Farm Fieldmen (9) Store Breeding Farms GrowingFarms RDC’s Processor Abattoir NDC Stock = 0.3 dHandling 10 m Stock = 5.5dButchery = 2m RM = 0.25dWIP = 0 FP = 0 RM = 0.5dWIP = 1.2 d FP = 2.6 d -Defects report by cust = ? % Target Output = 7500/ wk Target Output = 6000/ wk Operates 7 dShifts 3 Operates 7 dShifts 2 Output = 94 % Operates 5 d Operates 5 d(Despatch 7 d)Shifts 1 Output = 87 % Defects = ? % Shifts = 1 -Internal loss %-Defects report by cust = % Defects = ? % Defects = ? % Defects = % -Internal loss %-Defects report by cust = % Availability ? w Farms Availability ? w Meat Processing Distribution Retail 4h 4h 0 2h 4h 3h 20 wks (20w) 20 wks (20w) .0.25d (5m) 4.3d ( 127sec) 0.3d (0) 0.3d (0) 5.5d ( 1m) Time in the facility Value Added Time Abattoir to Check out Total Time 11.3 daysStock time 10.7 daysVA time = c 8 minTransport = 9 hr
Develop Future State Map : Potential Operational Improvements ForecastsAnnual /Qtrly /Weekly/ Daily Get Visibility of Real weekly Demand all along chain Product’n Manager HQPork Selector (HQ) Marketing DeptMkt ResearchNew Prod IntroPackagingPricing Get One Forecast for whole chain (HQ)Procurement Manager )A/c Mgr Retail Link System Forecast pig available Weekly requirement Forecasts New Prod Introduction 33 weeks Weekly actual available ? Daily sales data by store Weekly Requirementt by abattoir Develop Demand Management Policy Logistics Manager HQInforem System (Processor) Prod’n Control Weekly demand& capacity New Prod Introduction 2 months to 45 mths Daily order by RDC Daily order Farm Managers (2) (HQ) Central Planning TeamThursday meeting DespatchControl Daily scheduleby product type HQSupply Mgr StoreMeat Mgr Forecast Tue & Thur 7 day rolling & Seasonality trends Daily despatch schedule Introduce O F E Tighter controls on batch finishing Stock Reduction Daily epos data Farm Fieldmen (9) Stores Demand = 1740 loins /day = 870 pigs Processor Abattoir ASDARDC’s (6) Farm Breeding Farms Growing Farms (Cross Dock) Processing Reduce Stock Stock = 0.3 dHandling 10 m Stock = 5.5dButchery = 2m RM = 0.25dWIP = 0 FP = 0 RM = 0.5dWIP = 1.2 d FP = 2.6 d -Defects report by cust = ? % Target Output = 7500/ wk Target Output = 6000/ wk Operates 7 dShifts 3 Operates 7 dShifts 2 Master class on Farms Output = 94 % Operates 5 d Operates 5 d(Despatch 7 d)Shifts 1 Output = 87 % ReconcileChargeable Weights Defects = ? % Shifts = 1 -Internal loss %-Defects report by cust = % Defects = ? % Defects = ? % Defects = % -Internal loss %-Defects report by cust = % Availability ? w Availability ? w Quality Management More consistent measurement & feedback 4h 4h 0 2h 4h 3h Quantify the Cost of Non-conformance 20 wks (20w) 20 wks (20w) .0.25d (5m) 4.3d ( 127sec) 0.3d (0) 0.3d (0) 5.5d ( 1m) Compress time Value Added Time Time in the facility Farm to Check out Total Time 41 wks 4 days Stock time 10.7 daysVA time = 40 wks 8 minTransport = 17 hr
Value Chain Analysis Methodology… Introductory Meeting Agree Team and Events Day 1 Lean VCA Workshop Team Build Lean Familiarisation Construct ‘ big picture’ map Day 2 VCA Current State Mapping of processes within each facility Day 3-6 In House Opportunities Confirm End to End Map Company Future States Day 7-8 Chain opportunities Cost/Benefit Matrix Executive Report VCA Future State Day 9-10
Value Chain Analysis : Benefits • A joint value chain mapping team – a practical way to develop real cooperation & a joint vision • The whole team goes & sees all the operations and gets a real understanding of each other’s issues • Each firm identifies internal improvement opportunities • Opportunities are identified that are only available when firms cooperate
Corus – Metsec – Gateway Steel coils Sections Caravan Chassis Benefits from Supply Chain Cooperation • Stock reduction across the Chain - 50% • On-time Delivery Improvement < 90% to 98% • Quoted Order to delivery lead time 21 days to 3 days • Increased Mutual Business + 40%
Sales Business Manager Sales Demand Manager Customer Support Despatch OPT Material Supply Customer Support Prodn., Stores, Machining, Assy, Test, Finish Customer Mapping Order Intake & Processing 37 Steps in total 6 Value Adding Non-Value Added Necessary Non-Value Added Value Added
Monthly sales meeting with zone manager. Central Planning Office Central Sales Office National Sales Company • Production • availability • Material • constraints Dealer - UK • Sales request • all markets • all models Sales forecast per market monthly submission • Production Programme • monthly meeting • decides on allocations • Finance input • Forecast 1 year horizon • Volume Commitment • depends strongly from • VM to VM Down-days, Shift patterns, etc. Request for Production Capacity Order Bank 8.8 days Feedback allocation per market, allocation of constraint items Stock Orders Order Input 3.8 days Production Programme for month M+2-3 Monthly Yearly forecast 12 mths out • Direct order entry • online • feedback on build week • within a day • First Tier • Suppliers • ca. 300 - XX • local content 30-80% • Limited or no order • amendment facility • 2 weeks: engine, • transmission • 1 week: colour, trim • days: some options Schedules 3-4 weeks firm covers also 6 months forecast weekly • ORDER BANK • holds ‘available • to schedule’ orders Build date feedback Scheduling 15.1 days Daily Call In daily requirements 2-17 days daily • Sequenced delivery, multidaily • line-side: modules and systems • Daily delivery against schedule or • kanban line-side or into • consolidation hub / resequencing centre • Weekly delivery against schedule • Monthly delivery against schedule/order Order Scheduling Tool Supply Constraints Sequence and Broadcast Messages 3hrs -7 days! Schedules orders according to boundaries set in production programme Daily, plus update / warning messages Sequencing 6.5 days Small Parts Warehouse Bulk Parts Warehouse Kanban / Consolidation Point Resequencing • Sequencing Tool in plant or • centrally. Approaches: • fix sequence and resequence as required • make bodies as per daily schedule, • and resequence manually or • automatically for paint and assembly Feedback to order bank weeks days Hours to days Every 30min - 3 hrs Distribution 3.7 days Production 1.4 days Leave Factory 0.9 days Traffic Control System Body Bank: Resequencing for paint, or FIFO Paint Interim Storage: FIFO or batching for paint if body bank FIFO Paint Bank: Resequencing for load levelling on the line WELD PRIMER TOPCOAT ASSEMBLY Testing GATE RELEASE Load Lanes DC or RDC or Distribution Points typically 1 (DC), 4 (RDC), or 10 distribution points Average 1 day Transfer to load Dealer UK Rework Internal Supplier e.g. Engine Assembly First Framing to Gate Release: 1.4 days, excl. rework 0.9 day Transfer, 3.8 days shipping to dealer The 3 Day Car Project Total lead time = 40 days Making & distrib car = 6 days Info Processing = 34 days European Car Makers Made–to-order CarAverage 40 days lead time
Lean Applied in The Public Sector Local Government The BBC Hospitals
Medway Hospital: Emergency Medical GP Referral Decision Flow Duplication of paper & computer systems Decisions=Major Source of Delay to patient progress Info Doesn’t Flow No standard system to ensure decisions Flow Major Cause of delay to patient flow Complex & time consuming Decision making often ad-hoc Lot of decision points( 17) & Many People involved Evolved Not planned Non systematic 8 process steps & 9 queues Information Flow 6-8 hrs from GP to bed Patient Flow & time Mapping by Walking the process With a pencil, paper & rubber 5- 8 days in-patient 1-5 hours to discharge
Lean Future State Vision Current State Number of steps 24 Number of value steps 24 Time 4 -6 hrs in hospital 10 hrs input at home Number of steps 67 Number of value steps 27 Time 10 days in hospital Medway : Lean Thinking Pilot
Medway : Value Stream Mapping • For the first time people start to see & understand the whole process of a patient coming into, through & out of hospital • Started ‘patient-centred’ process thinking • Identified wastes & inconsistencies • Led to immediate waste removal
Lean Applied to Global Supply Chains Texon : Shoe Components UK to SE Asia
Current State Map Global Supply Chain : Shoe Components Ports of Entry Shoe OEM’s China 50% H Kong Jakarta Indo’ 25% UK Factory Shoes to world markets 6 3 UK Port Sing’ Port Sing’ Port 20 21 H Chi M Viet 20% FF W ‘h Sing’ W ‘h 5 6 1 1 3 17 3 1 1 3 5 3 3 Bangkok Thai 5% Processing / Transport 52 days Inventory 50 days Total Pipeline Time 102 days Production Order Processing
Future State Map Restructure the chain & operational improvements Regularised Production Ship direct to HK Safety Stock at ports close to markets No Singapore W / house Regularised Shipment 1 Cont /week Load direct to container China 50% H Kong Port Deliver direct to port Jakarta Indo’ 25% UK Factory Shoes to world markets UK Port Sing’ Port H Chi M Viet 20% Bangkok Thai 5% UK FF to control all 1.5 7 14 17 0 3 1 3 3 5 3 3 Processing / Transport 35 days Inventory 23 days Total Pipeline Time 58 days Production Order Processing
Future State Map Lean Principles Applied Standard Op’s Regularised Production Ship direct to HK Demand M’gmt Safety Stock at ports close to markets No Singapore W / house Regularised Shipment 1 Cont /week Waste Elim’ Load direct to container Pull FLow China 50% H Kong Port Deliver direct to port Jakarta Indo’ 25% S Chain Synchronisation Time Compression UK Factory Shoes to world markets UK Port Sing’ Port H Chi M Viet 20% Bangkok Thai 5% UK FF to control all 1.5 7 14 17 0 3 1 3 3 5 3 3 Processing / Transport 35 days Inventory 23 days Total Pipeline Time 58 days Production Order Processing Before After Processing / Transport 52 35 days Inventory 50 23 days Total Pipeline Time 102 58 days
Conclusions : So why Lean? • Lean shifts the focus from managing assets to managing end to end processes • It reveals opportunities by distinguishing what creates value from what does not • It gives people the tools to redesign their processes to cut unnecessary steps and time • And it builds a social basis for collaboration between partners to achieve and sustain improvement
What is Lean aiming for :- For Businesses Gaining Competitive Advantage And More Business At More Profitable Levels For Non-Profit Organisations Improving Efficiency Better Service
Unlocking the Potential in the Supply Chain through Lean Logistics David TaylorSenior Research Fellow Lean Enterprise Research CentreCardiff University Email taylordh@cf.ac.uk Tel 00 44 114 263 0705