Download

1 / 24
270 likes | 317 Vues
Learn about main nutritional assessment methods and the purpose of nutritional surveillance in emergencies. Understand how data is collected, analyzed, and used for decision-making. Discover the steps in conducting a nutritional survey and the importance of quality control.

E N D
Food and Nutrition Surveillance and Response in Emergencies Session 11 Nutritional Assessment and Analyses
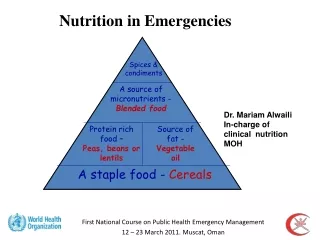
Main Nutritional Assessment Methods • Anthropometry: wt, ht, MUAC, (mainly for <5yrs since they are sensitive to factors influencing nutritional status-illness/ food • Biochemical Methods • Clinical Assessment • Dietary Methods
Nutritional Surveillance Is the process of monitoring changes in the nutritional status of a population over a period of time. Nutrition surveillance involves Data collection, processing, Analyses, Interpretation and Communication
Purpose of nutritional Surveillance • Nutrition data is a vital indicator for the overall health and welfare of populations especially where regular demographic and health surveys are lacking. • Surveillance data is critical for making decisions that will assist in improved nutrition outcomes of a population e.g. when to start or phase out a nutrition intervention such as supplementary feeding program. • Nutrition data can be used in crisis mitigation especially as an early warning indicator to respond to threats such as droughts or disease outbreaks.
Data collected assists in providing baseline information on nutrition, socio-economic factors, demographic characteristics, food security and cultural aspects of a population • Information is important for decision making on program planning, management, monitoring and evaluation
Type of data • Quantitative: numeric • Qualitative: Narrative (to supplement the quantitative data) – FGD, formal (in-depth) and informal interviews of key informants, case studies, observation,
Principle Users • Communities involved in the design, planning and management of nutrition related programs • Government authorities and Non Governmental Organizations supporting food security, health and nutrition related programs
Food Aid agencies e.g. WFP, CARE • Donors • Industries addressing nutrition and health related issues
Nutrition Surveillance in Somalia by FSAU utilizes diverse range of information sources to develop an efficient and effective nutrition surveillance system. These are, nutrition surveys, health facilities, rapid assessment, and sentinel sites.
A nutritional survey is a method by which information is obtained concerning the nutritional status of a population or a subgroup. Such information is collected by asking nutrition related questions in an interview to a representative sample of the population.
Steps in conducting survey • Planning the survey • Administering the survey: partner contacts, training and tool pre-testing, data collection, data management, report and presentation (quality control maintained in all steps).
Planning Survey • A review of the existing information related to the anticipated survey area • Identify survey goals and objectives: • Identify survey indicators • Selecting survey methodology • Select survey sample
Survey plan (cont’) • Liaising with partners: roles & responsibilities • Data collection tools and instrument • Pre-testing the tools • Data collection NB: quality control ensured at all levels
Typical survey designs include: • Longitudinal survey: data is collected for the same population over a long period of time. Longitudinal studies are useful in establishing trends over a long period of time • Cross-sectional surveys: This is one of the commonly used survey designs that looks into population issues at a given point in time. • In emergency: Cross sectional survey mainly used.
Sampling methods are: • Two Stage Cluster sampling • Random sampling • Systematic sampling • Stratified sampling
When to conduct Survey • At the beginning of a nutrition project cycle to provide baseline information for program formulation • During initial phase of emergency situation to measure nutritional status and plan a short term response • During the course of the nutrition program to assess and monitor the impact
monitor progress (regular monitoring of the situation) • At the end of the project circle to evaluate its extent and impact • Any other time deemed necessary to establish a baseline.
Type of info. in surveys • Demographic – HH details, residential status • Socio-economic issues: income, food source, coping strategies, water source, hygiene • Anthropometric measurements • Intervention coverage • Morbidity • Food consumption • Mortality
Quality control measures • Thorough training of staff plus pre-testing of tools (interpretation of the questionnaires, if necessary) • Standardization tests- Intra-personal/ interpersonal errors • Close monitoring of the field work by qualified persons • Cross-checking of the field questionnaires for anomaly daily • Daily review of enumerator experiences and problems • Progress review per plan and by checklist • Data cleaning: collection, entry, • Integrity of equipments: maintain accuracy using known weights
Health Facility • Summary of anthropometric measurements of <5yrs, morbidity and EPI from MCH collected • The MCH are located in vast vulnerable area • Data collected from it serve as early indicator in case of crises. • HF data indicates trends in malnutrition rates over a period of time • N.B. Data from HF is not representative of the entire population and it’s biased since only the sick or those who can access the health facility are assessed
Key issues in site based surveillance • Importance of carrying out surveillance • Anthropometric data- quality of data/integrity of equipment and staff quality • Recording and interpreting measurements • Clinical diagnosis: obvious micronutrient deficiency- VAD, anaemia, IDD • Causes of malnutrition
Rapid Assessment Mainly carried out on ad hoc bases. Useful when: • When nutrition information are fast needed • When resources of carrying out Nutrition survey are limited. • MUAC is usually used. Additional methods include: FGD, Key informant interview, observation (transect walks), seasonal calendars and Case study.
Steps in planning a rapid assessment • Define objectives (who to assess-children, women, why), • Determine target site/area/population • Develop appropriate method of data collection: representative • Staff identification and training (involve the existing authority) • Materials and equipment
Type of information • MUAC measurements: adults (women), <5yr • Food availability and accessibility • Water sources • Common diseases- how are recent trends • Access to health services/ other interventions • Livestock and population movement- destinations/ origin of emigrants • Type of food consumed/freq. of feeding • Security situation