Download
1 / 42
420 likes | 594 Vues
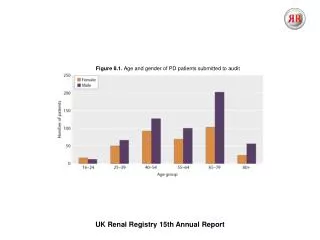
Survival comorbidity Mrs Retha Steenkamp Senior Statistician UK Renal Registry. UK Renal Registry 2011 Annual Audit Meeting. Importance of co-morbidities in survival. Co-morbidities collected by the Renal Registry Missing co-morbidities Accuracy of co-morbidities Importance of co-morbidities.

E N D
Survival comorbidityMrs Retha SteenkampSenior StatisticianUK Renal Registry UK Renal Registry2011 Annual Audit Meeting
Importance of co-morbidities in survival Co-morbidities collected by the Renal Registry Missing co-morbidities Accuracy of co-morbidities Importance of co-morbidities
UK Renal Registry comorbidities 15 Comorbidities: Heart disease: angina, MI in past 3 months, MI >3 months ago, CABG/angioplasty, heart failure Non-cardiac vascular disease: cerebrovascular disease, claudication, ischaemic/neuropathic ulcers, amputation for PVD, non-coronary angioplasty/vascular graft Other: diabetes (not cause of ERF), liver disease, ‘smoking’, malignancy, COPD
Drawbacks of current comorbidity data Important comorbidities not collected: dementia and mobility Heart failure not collected by all centres Degree of severity not collected Smoking: current smoker, smoking within last year Malignancy
Problems caused by missing co-morbidity data Not adjusting for comorbidity might lead to inadequate case-mix adjustment Case-mix adjustment in statistical models are limited to complete cases - Loss of statistical power - Loss of information - Selection bias - Lack of generalisability Most standard statistical methods assumes complete data
Patterns and effects of missing co-morbidity data - 1 Patients with missing co-morbidity data do considerably worse Proportion of patients with co-morbid condition may be higher amongst those with missing co-morbidity data Multiple imputation found a higher prevalence of co-morbid conditions than seen in those with available data
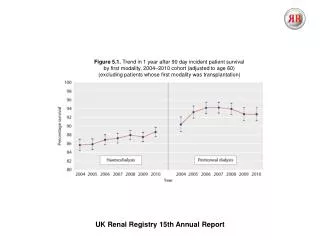
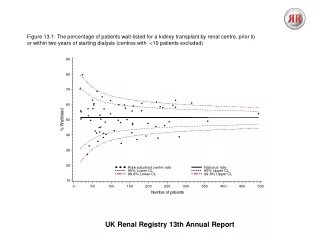
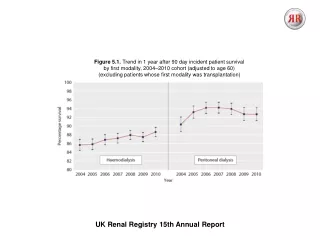
Unadjusted 1 year survival of incident RRT patients, 1997-2007
Survival per comorbidity for incident RRT patients, 1997-2007
Patterns and effects of missing co-morbidity data – 2 Treating missing co-morbidity data as indication of an absent co-morbidity (i.e. a tick only if yes policy) would lead to an attenuation of the association between co-morbidity and survival
Accuracy of co-morbidity data – 1 17 regularly collected co-morbidities (USRDS data) were validated against co-morbidities collected for the ICED Findings for sensitivity: - reasonably good (>0.80) for only 1 co-morbidity - moderate (0.77-0.67) for 4 co-morbidities - intermediate (0.52-0.40) for 7 co-morbidities - poor (<0.40) for 5 co-morbidities - Average across all 17 co-morbidities was 0.59% - Higher in PD and diabetic patients - Less accurate for each co-morbidity added The study has shown that co-morbidities were severely underreported Longenecker , JASN 2000
Accuracy of co-morbidity data – 2 Self-reporting of 8 co-morbidities compared to medical records and physician reports Self-reporting varied with specific co-morbid condition. Substantial agreement for diabetes (k=0.93) and coronary artery intervention (k=0.79), but poor agreement for COPD (k=0.20) Co-morbidities reported by the physician equal or lower to patient self-reporting The study has shown that co-morbidities were severely underreported Merkin, Journal of Clinical Epidemiology, 2007
Accuracy of co-morbidity data – 3 The UK Renal Registry performed a data validation exercise in the Welsh centres Registry data was validated for completeness and accuracy against information held in the unit’s renal IT system and patient notes Twenty patients were randomly selected from each unit Only 2 renal centres were found to regularly capture co-morbidity data and completeness and accuracy was 87-100%
Accuracy of co-morbidity data – 4 The ANZDATA registry investigated the accuracy of co-morbidities: confirmed co-morbid conditions were accurately reported result opinion based in the absence of a gold standard (Karamadoukis, NDT, 2009) Canadian Organ Replacement Register (CORR) assessed the quality of data collected by comparing with medical charts: co-morbidities were under-reported sensitivities ranged from 89% for hypertension to 47% for PVD specificity was >0.93 for all co-morbidities except hypertension (Moist, CJASN, 2011)
Importance of co-morbidities in patients on RRT -1 • The selection of modality and patient outcomes are affected by case-mix factors such as co-morbidity • Well completed co-morbidity data will enable the selection of patients based on their co-morbidities for further study • Individual patient co-morbidity and prognosis • UK country and centre level comparisons and co-morbidities • International co-morbidity comparisons
Variance explained by co-morbidity • A study by van Manen et al. compared survival between 5 European countries • After adjusting for age, gender, PRD, modality and country, adjusting for 5 co-morbidities (diabetes mellitus, ischaemic heart disease, PVD, cerebrovascular disease and malignancy) explained only 1.9% of additional variation in outcome on top of the 14.4% • van Manen, NDT, 2007
Variance explained by individual comorbidities, survival after 90 days
Prognostic co-morbidities • Should co-morbidity collection be reduced to a core set with a strong association to outcome? • A study by Miskulinet al. tried to determine which co-morbidities are most prognostic and whether co-morbidities continue to contribute to survival once laboratory and clinical factors have been accounted for
Prognostic co-morbidities - 2 • Result: • 17 out of a total of 45 co-morbidities are most prognostic and provide equivalent discrimination and explained variance compared to the 45 co-morbidities • Variance explained increased from 13% to 17% upon adding co-morbidities to demographic and laboratory/clinical parameters Miskulin, CJASN, 2009
Prognostic co-morbidities - 3 CHF, Congestive heart failure PVD, Peripheral vascular disease MI, Myocardial infarction COPD, Chronic obstructive pulmonary disease 25
Is the severity of co-morbidities important? • A study by Miskulin et al. investigated if the change in co-morbidity predict survival in incident dialysis patients • Results: the increase in the severity of existing co-morbid conditions and additional co-morbidities after start of RRT are important prognostic markers, independent of other case-mix factors • Miskulin, AJKD, 2003
Is the severity of co-morbidities important? • Large multicentre study compared existing co-morbidity indices (Khan, Davies and Charlson) with a new index that included disease severity • Charlson index discriminated best • Adding severity grading for 4 co-morbid conditions did not improve discrimination • van Manen, AJKD, 2002
Conclusion Outcome differences between patients with and without co-morbidity Co-morbid conditions are important predictors of outcome Important in explaining differences between centres and UK nations and important for individual prognosis Validation exercises have shown that co-morbidities are severely under-reported Co-morbidities do add to variance explained and add a modest amount of independent prognostic information that cannot be substituted by clinical/laboratory parameters
Acknowledgements Many thanks to: UK renal centres and patients Data and systems staff (UKRR) Biostatisticians (UKRR)
Prognostic survival prediction tool Prognostic information is rarely discussed with patients because of clinical uncertainty about accuracy Promising methods for formulating prognosis applied to ESRD: Survival estimates using a statistical model The clinician’s prediction of survival Combination of the two methods Prognostic survival tool was developed and validated for HD population LM Cohen, R Ruthazer, AH Moss, MJ Germain: Predicting six-month mortality for patients who are on maintenance hemodialysis. Clin J Am Soc Neprol 2010; 5:72-79
Variance explained by individual comorbidities after adjusting for age and gender, survival after 90 days
What is multiple imputation? Developed by Rubin in a survey setting as a statistical technique for analysing data sets with missing observations Imputation: Missing values are replaced by imputations The imputation procedure is repeated many times with each dataset having the same observed values and different sets of imputed values for missing observations 2. Analyse using standard statistical methods 3. Pooling parameter estimates
Missing data mechanism and multiple imputation Missing Completely At Random (MCAR): The probability of a value being missing does not depend on observed or unobserved measurements Missing at Random (MAR): Given the observed data, the missingness mechanism does not depend on the unobserved data. Missing not at Random (MNAR): Even when accounting for all the available observed information, the reason for being missing still depends on the unseen observations themselves
Unadjusted 1 year after 90 days survivalof incident RRT patients, 1997-2007
Survival 1 year after 90 days for incident RRT patients in 2003-2007, adjusted for age, diagnosis and comorbidity
Additional variance explained by prognostic factors, survival after 90 days
Recording of comorbidities Comorbidities are captured at start of renal replacement therapy (RRT) Manual data entry into the renal IT system Process of data entry varies by renal centre: Directly entered by senior medical staff (consultant) Entered from updated form by data management staff
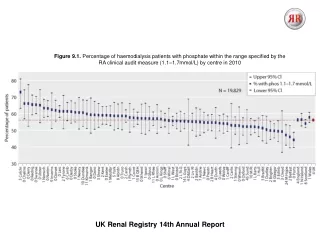
Percentage prevalence of co-morbidity in those with complete data and in those with missing data