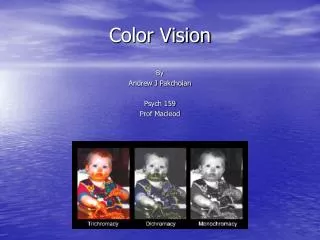
Computer Vision - Color
Computer Vision - Color. Hanyang University Jong-Il Park. Topics to be covered. Light and Color Color Representation Color Discrimination Application. The visible light spectrum. We “see” electromagnetic radiation in a range of wavelengths. Relative sizes. Light spectrum.

Computer Vision - Color
E N D
Presentation Transcript
Computer Vision -Color Hanyang University Jong-Il Park
Topics to be covered • Light and Color • Color Representation • Color Discrimination • Application
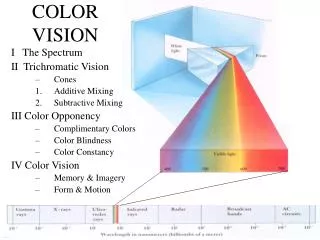
The visible light spectrum • We “see” electromagnetic radiation in a range of wavelengths
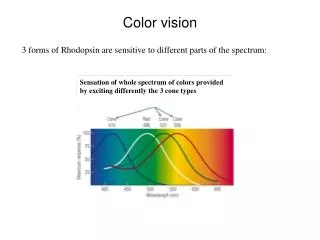
Light spectrum • The appearance of light depends on its power spectrum • How much power (or energy) at each wavelength daylight tungsten bulb • Our visual system converts a light spectrum into “color” • This is a rather complex transformation
The human visual system • Color perception • Light hits the retina, which contains photosensitive cells • rods and cones • These cells convert the spectrum into a few discrete values
Density of rods and cones • Rods and cones are non-uniformly distributed on the retina • Rods responsible for intensity, cones responsible for color • Fovea - Small region (1 or 2°) at the center of the visual field containing the highest density of cones (and no rods). • Less visual acuity in the periphery—many rods wired to the same neuron Rod Cone Retina light
Relative neural response of rods as a function of light wavelength. 1.00 0.75 0.50 Relative response 0.25 0.00 400 500 600 700 Wavelength (nm) Rods: Twilight Vision • 130 million rod cells per eye. • 1000 times more sensitive to light than cone cells. • Most to green light (about 550-555 nm), but with a broad range of response throughout the visible spectrum. • Produces relatively blurred images, and in shades of gray. • Pure rod vision is also called twilight vision.
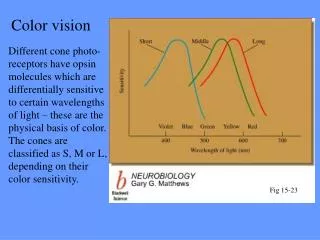
Spectral absorption of light by the three cone types 1.00 M S L 0.75 0.50 Relative absorbtion 0.25 0.00 400 500 600 700 Wavelength (nm) Cones: Color Vision • 7 million cone cells per eye. • Three types of cones* (S, M, L), each "tuned" to different maximum responses at:- • S : 430 nm (blue) (2%) • M: 535 nm (green) (33%) • L : 590 nm (red) (65%) • Produces sharp, color images. • Pure cone vision is called photopic or color vision. *S = Short wavelength cone M = Medium wavelength cone L = Long wavelength cone
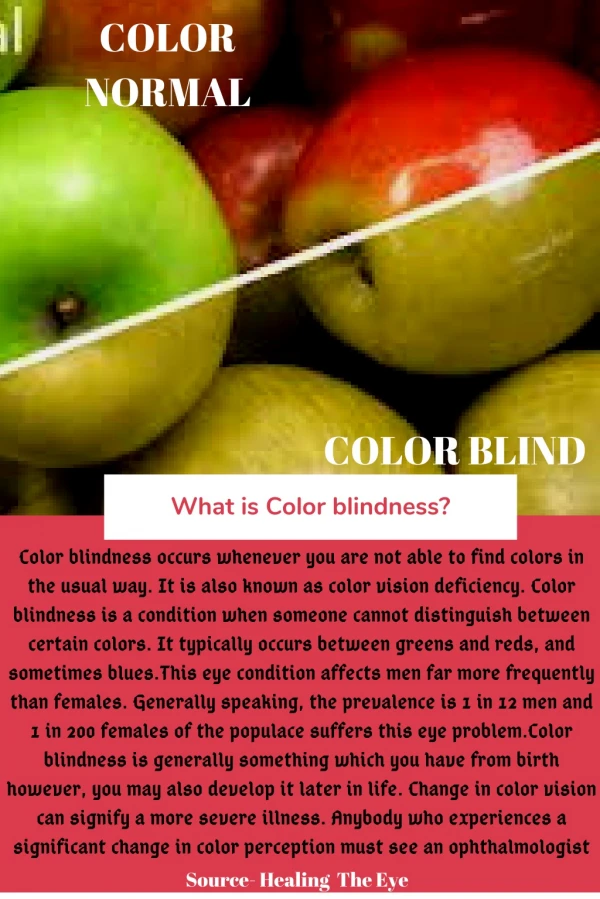
Color perception • Three types of cones • Each is sensitive in a different region of the spectrum • Different sensitivities: we are more sensitive to green than red • varies from person to person (and with age) • Colorblindness—deficiency in at least one type of cone L response curve
M L S Color perception • Rods and cones act as filters on the spectrum • To get the output of a filter, multiply its response curve by the spectrum, integrate over all wavelengths • Each cone yields one number • Q: How can we represent an entire spectrum with 3 numbers? Power Wavelength • A: We can’t! Most of the information is lost. • As a result, two different spectra may appear indistinguishable • such spectra are known as metamers • http://www.cs.brown.edu/exploratories/freeSoftware/repository/edu/brown/cs/exploratories/applets/spectrum/metamers_guide.html
Spectral absorption of light by the three cone types Effective sensitivity of cones (log plot) 1.00 M S L 0.75 0.50 Relative absorbtion 0.25 1.00 L M 0.00 0.1 S 400 400 500 500 600 600 700 700 Wavelength (nm) Wavelength (nm) 0.01 Relative sensitivity S, M, and L cone distribution in the fovea 0.001 0.0001 Eye Color Sensitivity • Although cone response is similar for the L, M, and S cones, the number of the different types of cones vary. • L:M:S = 40:20:1 • Cone responses typically overlap for any given stimulus, especially for the M-L cones. • The human eye is most sensitive to green light.
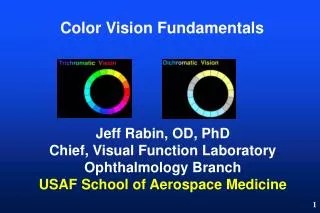
r g b Tristimulus values Theory of Trichromatic Vision • The principle that the color you see depends on signals from the three types of cones (L, M, S). • The principle that visible color can be mapped in terms of the three colors (R, G, B) is called trichromacy. • The three numbers used to represent the different intensities of red, green, and blue needed are called tristimulus values. =
Illumination source x • Illumination source Object reflectance factor • Object reflectance x • Observer response Observer spectral sensitivity • The product of these three factors will produce the sensation of color. = r g b Observer response Tristimulus values (Viewer response) Seeing Colors • The colors we perceive depends on:-
Additive Colors • Start with Black – absence of any colors. The more colors added, the brighter it gets. • Color formation by the addition of Red, Green, and Blue, the three primary colors • Examples of additive color usage:- • Human eye • Lighting • Color monitors • Color video cameras Additive color wheel
Subtractive Colors • Starts with a white background (usually paper). • Use Cyan, Magenta, and/or Yellow dyes to subtract from light reflected by paper, to produce all colors. • Examples of Subtractive color use:- • Color printers • Paints Subtractive color wheel
W M B R K Y C G Using Subtractive Colors on Film • Color absorbing pigments are layered on each other. • As white light passes through each layer, different wavelengths are absorbed. • The resulting color is produced by subtracting unwanted colors from white. White light Green Red Blue Black White Pigment layers Cyan Yellow Magenta Yellow Magenta Cyan Black Reflecting layer (white paper)
9 Relative power 0 380 480 580 680 780 Wavelength (nm) The dashed line represents daylight reflected from sunflower, while the solid line represents the light emitted from the color monitor adjusted to match the color of the sunflower. Metamerism • Spectrally different lights that simulate cones identically appear identical. • Such colors are called color metamers. • This phenomena is called metamerism. • Almost all the colors that we see on computer monitors are metamers.
9 9 9 Relative power Relative power Relative power 0 0 0 380 380 380 480 480 480 580 580 580 680 680 680 780 780 780 Wavelength (nm) Wavelength (nm) Wavelength (nm) The Mechanics of Metamerism • Under trichromacy, any color stimulus can be matched by a mixture of three primary stimuli. • Metamers are colors having the same tristimulus values R, G, and B; they will match color stimulus C and will appear to be the same color. The two metamers look the same because they have similar tristimulusvalues.
Human vision gamut Photographic film gamut 0.8 0.6 y 0.4 Monitor gamut 0.2 0 0 0.2 0.4 0.6 0.8 x Gamut • A gamut is the range of colors that a device can render, or detect. • The larger the gamut, the more colors can be rendered or detected. • A large gamut implies a large color space.
Color Spaces • A Color Space is a method by which colors are specified, created, and visualized. • Colors are usually specified by using three attributes, or coordinates, which represent its position within a specific color space. • These coordinates do not tell us what the color looks like, only where it is located within a particular color space. • Color models are 3D coordinate systems, and a subspace within that system, where each color is represented by a single point.
Color Spaces • Color Spaces are often geared towards specific applications or hardware. • Several types:- • HSI (Hue, Saturation, Intensity) based • RGB (Red, Green, Blue) based • CMY(K) (Cyan, Magenta, Yellow, Black) based • CIE based • Luminance - Chrominance based CIE: International Commission on Illumination
Cyan (0,1,1) Blue (0,0,1) Magenta (1,0,1) White (1,1,1) Green (0,1,0) Black (0,0,0) Red (1,0,0) Yellow (1,1,0) RGB Color Space RGB* • One of the simplest color models. Cartesian coordinates for each color; an axis is each assigned to the three primary colors red (R), green (G), and blue (B). • Corresponds to the principles of additive colors. • Other colors are represented as an additive mix of R, G, and B. • Ideal for use in computers. *Red, Green, and Blue
Full Color Image Red Channel Green Channel Blue Channel RGB Image Data
White Magenta Red Blue Black Yellow Cyan Green CMY(K)* • Main color model used in the printing industry. Related to RGB. • Corresponds to the principle of subtractive colors, using the three secondary colors Cyan, Magenta, and Yellow. • Theoretically, a uniform mix of cyan, magenta, and yellow produces black (center of picture). In practice, the result is usually a dirty brown-gray tone. So black is often used as a fourth color. Producing other colors from subtractive colors. *Cyan, Magenta, Yellow, (and blacK)
Cyan Image (1-R) Full Color Image Magenta Image (1-G) Yellow Image (1-B) CMY Image Data
CMY – RBG Transformation • The following matrices will perform transformations between RGB and CMY color spaces. • Note that:- • R = Red • G = Green • B = Blue • C = Cyan • M = Magenta • Y = Yellow • All values for R, G, B and C, M, Y must first be normalized.
HSI / HSL / HSV* • Very similar to the way human visions see color. • Works well for natural illumination, where hue changes with brightness. • Used in machine color vision to identify the color of different objects. • Image processing applications like histogram operations, intensity transformations, and convolutions operate on only an image's intensity and are performed much easier on an image in the HSI color space. *H=Hue, S = Saturation, I (Intensity) = B (Brightness), L = Lightness, V = Value
Blue 240º Red 0º Green 120º • Saturation • Degree to which hue differs from neutral gray. • 100% = Fully saturated, high contrast between other colors. • 0% = Shade of gray, low contrast. • Measured radially from intensity axis. RGB cube viewed from gray-scale axis, and rotated 30° HSI Color Wheel RGB cube viewed from gray-scale axis RGB Color Space Saturation 0% 100% HSI Color Space • Hue • What we describe as the color of the object. • Hues based on RGB color space. • The hue of a color is defined by its counterclockwise angle from Red (0°); e.g. Green = 120 °, Blue = 240 °.
100% Intensity Hue 0% 100% Saturation 0% HSI Color Space • Intensity • Brightness of each Hue, defined by its height along the vertical axis. • Max saturation at 50% Intensity. • As Intensity increases or decreases from 50%, Saturation decreases. • Mimics the eye response in nature; As things become brighter they look more pastel until they become washed out. • Pure white at 100% Intensity. Hue and Saturation undefined. • Pure black at 0% Intensity. Hue and Saturation undefined.
Hue Channel Saturation Channel Intensity Channel Full Image HSI Image Data
CIE L*a*b* Color Space / CIELAB • Second of two systems adopted by CIE in 1976 as models that better showed uniform color spacing in their values. • Based on the earlier (1942) color opposition systemby Richard Hunter called L, a, b. • Very important for desktop color. • Basic color model in Adobe PostScript (level 2 and level 3) • Used for color management as the device independent model of the ICC* device profiles. CIE L*a*b* color axes *International Color Consortium
100 L* -a +b -b +a 0 CIE L*a*b* (cont’d) • Central vertical axis : Lightness (L*), runs from 0 (black) to 100 (white). • a-a' axis: +a values indicate amounts of red, -a values indicate amounts of green. • b-b' axis, +b indicates amounts of yellow; -b values indicates amounts of blue. For both axes, zero is neutral gray. • Only values for two color axes (a*, b*) and the lightness or grayscale axis (L*) are required to specify a color. • CIELAB Color difference, E*ab, is between two points is given by: (L1*, a1*, b1*) (L2*, a2*, b2*) CIE L*a*b* color axes
Full Color Image L data L-a channel L-b channel CIELAB Image Data
Relationship between Scene and Image Brightness • Before light hits the image plane: Scene Radiance L Image Irradiance E Scene Lens Linear Mapping! • After light hits the image plane: Camera Electronics Image Irradiance E Measured Pixel Values, I Non-linear Mapping! Can we go from measured pixel value, I, to scene radiance, L?
Demosaicking Cf. 3CCD camera
Relation between Pixel Values I and Image Irradiance E Camera Electronics Image Irradiance E Measured Pixel Values, I The camera response function relates image irradiance at the image plane to the measured pixel intensity values. (Grossberg and Nayar)
Radiometric Calibration • Important preprocessing step for many vision and graphics algorithms such as • photometric stereo, invariants, de-weathering, inverse rendering, image based rendering, etc. • Use a color chart with precisely known reflectances. 255 ? Pixel Values g 0 ? 0 1 90% 59.1% 36.2% 19.8% 9.0% 3.1% Irradiance = const * Reflectance • Use more camera exposures to fill up the curve. • Method assumes constant lighting on all patches and works best when source is • far away (example sunlight). • Unique inverse exists because g is monotonic and smooth for all cameras.
The Problem of Dynamic Range • Dynamic Range: Range of brightness values measurable with a camera (Hood 1986) • Today’s Cameras: Limited Dynamic Range High Exposure Image Low Exposure Image • We need 5-10 million values to store all brightnesses around us. • But, typical 8-bit cameras provide only 256 values!!
High dynamic range imaging • Techniques • Debevec: http://www.debevec.org/Research/HDR/ • Columbia: http://www.cs.columbia.edu/CAVE/tomoo/RRHomePage/rrgallery.html
LED Cluster camera controller illumination 1 Illumination 2 scene Color Discrimination • Active approach • Using controlled lights • Passive approach • Using optical filters
Visual effect of illumination Synthetic Illumination LA Camera Blue Channel Camera Green Channel Camera Red Channel RGB Distance: 115.86 Halogen Lamp Xenon Lamp RGB Distance: 98.12 RGB Distance: 92.85
Imaging for Autonomous Vehicle • For traffic lights • Passive approach • Using optimized color filters • For pedestrian detection • Multispectral/hyperspectral imaging • Infrared band
Segmentation • Keying • Interactive segmentation [서울대]
Virtual Studio • NHK STRL: Synthevision, VS, DTPP (1989~1992) VS Overview paper: S.Gibbs et al.(1996)