Download
1 / 74
740 likes | 903 Vues
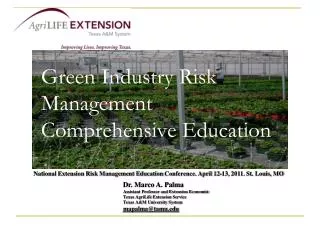
Risk Management for the Green Industry. Dr. Robin G. Brumfield Rutgers Cooperative Extension Risk Management Workshop June 7, 2000. Distribution of Farms and Land in Farms By Region, 1998. Top 6 Commodity Groups in the US. Beef Dairy Corn Soybeans Broilers

E N D
Risk Management for the Green Industry Dr. Robin G. Brumfield Rutgers Cooperative Extension Risk Management Workshop June 7, 2000
Top 6 Commodity Groups in the US • Beef • Dairy • Corn • Soybeans • Broilers • Green Industry 11% of crop cash receipts for farm crops in 1998.
U.S. Floriculture • 23.5 million sq. ft. of construction in 1997 • $37.2 billion in green industry expenditures • 9.8% growth 1986 - 90 • 3.4% growth 1991 - 95
Top 10 States in Cash Receipts • 1996%1987 % • California 20 California 22 • Florida 11 Florida 14 • North Carolina 8 Texas 7 • Texas 8 Pennsylvania 4 • Ohio 5 New York 3 • Oregon 5 Michigan 3 • Michigan 4 Oregon 3 • Pennsylvania 3 New Jersey 3 • Oklahoma 3 North Carolina 3 • New York 2 Ohio 3 • Source: Floriculture & Environmental Horticulture, Oct. 1997
Impressive green-industry growth • Total US growth has been extraordinary • Most states have expanded cash receipts • Market shares - some states have increased cash receipts, but failed to keep up with the growth in other states
U.S. Retail Expenditures • ItemBillion $ Per Capita • Cut Flowers & Greens 6.5 $26.80 • Flowering Potted Plants 3.4 $12.80 • Foliage Plants 2.9 $10.90 • Bedding Plants 2.6 $ 9.90 • Env. Hort. 21.2 $79.90 • Total 37.2 $140 • Source: Floriculture & Environmental Horticulture, Oct. 1997.
Percent of Households Buying Plants Plant% Annuals 25% Perennials 20% Rose Plants 13% Flowering Trees 9% Source: National Gardening Survey, 1994-95
43 • out of every • 100 • households • do not buy floricultural products!
Top 10 Crops CropShare of Value Roses 9% Mums (cuts & pots) 8% Poinsettias 7% Geraniums 6% Ferns 5% Carnations 3% Impatiens 3% Palms 3% Lilies (cuts & pots) 2% Petunias 2% Source: 1987 Census of Ag.
Only 6 • of every 100 • households • buy poinsettias, the number one potted crop!
Percent of Households Buying Lawn & Garden Products • Vendor% • Garden Center 51% • Mass Merchandiser 36% • Home Center 22% • Supermarket 17% • Source: National Gardening Survey, 1994-95.
Factors Impacting Demand • Income $35,000 vs. $30,000 • Education - 54% have one year of college • Age - 44% are over 18 • Housing Starts • Source: Gineo and Omano, 1990, Waldrop, 1993.
Factors Influencing Outlet Selection • Plant quality • Selection • Location • Price • Professional Assistance • Source: Padgett et al., 1995.
Limits to Expansion: Retail Firms • Market Demand • Available Capital • Labor • Competition • Source: Dole and Schnelle, 1993.
Value of an Acre of Production • Crop $ • Corn $350-$400 • Vegetables $4,000-$8,000 • Fruit $8,000-12,000 • Greenhouse flowers $350,000
How Does the US Stack Up? • Rank Share • Size of Consumer Market 1 31% • Value of Production 3 14% • Area in Production 3 9% • Importer 1 29% • Exporter 1 29% • Economic Output 1 22% • Source: Floriculture & Environmental Horticulture, Oct. 1997
US Weaknesses • Not having a good handle on the financial side of the business • Not thinking internationally
US Strengths • Next to the largest consumer market • Financially conservative • Operate under a wide range of conditions • Optimistic
Marketing/Advertising/MediaTrends • Market segmentation • Superstores and warehouse stores • Consolidation
Marketing/Advertising/MediaImpact on the Industry • Low prices from large producers • Decline of large, homogeneous, middle class • Not sure who the target market is • Many specialized production niches
Marketing/Advertising/MediaSolutions • Promote quality, not price • Promote service • Try new ideas as well as proven winners • Use cable TV to target local customers • Use 1-900 numbers • Develop good signs • Get involved in the community
Social/Lifestyle/ConsumerTrends • Consumers are more sophisticated • Growth of 2-income families • Consumers want “shopping experience” or “event marketing”
Social/Lifestyle/ConsumerImpact on the Industry • Can’t shop 9-5 • Limited time to work on landscapes • Limited time to shop
Social/Lifestyle/ConsumerSolutions • Create “shopping experiences” and “event marketing” • Market After Hours • Stand behind the product • Give your 800 number to customers • Sell processed and lightly processed items to save consumers time
Business/ManagementTrends • Global marketplace • Switch from producer-driven to consumer-driven economy • Information age
Business/ManagementImpact on the Industry • Competition from low cost countries • Age of surplus rather than shortage • Must offer quality prices to attract customers • Producers are farmers who have difficulty thinking of marketing from the consumer’s perspective
Business/Management Solutions • Become computer literate and train employees on the computer • Learn to surf the internet • Consider a webpage • Make electronic sales tax payment • Create value added products, don’t compete on price • Do things in slow months • Make your farm a shopping destination
Political/Legislative/RegulatoryTrends • Government regulation • Deer overpopulation • Increasing environmental/health concerns
Political/Legislative/RegulatoryImpact on the Industry • Deer damage • Consumers reluctant to purchase plants that deer may eat • Increasing demand for native, organic, and environmentally friendly plants • Loss of minor use pesticides • Recycling • Composting landscape wastes
Political/Legislative/Regulatory Solutions • Deer fencing, human hair, relocate deer, etc. • Sell and educate about biological pesticides • Start recycle programs • Chip trees and give away compost • Recycle water • Proactively present producer concerns to regulators • Educate on recycling, environmentally friendly landscapes, etc. • Be environmentally aware and responsible
Workforce/WorkplaceTrends • Low unemployment • Declining work ethic. How do farmers find, train and retrain motivated employees with skills they need at affordable wages? • Improved communications technology
Workforce/WorkplaceImpact on the Greenhouse Industry • Difficult to find part-time work • Wages are increasing • Difficult to find good help
Workforce/WorkplaceSolutions • Set up a training program for employees • Automate • Make daily lists of tasks • Make shopping more self-service
Financial Management is Critical to Success • Budgeting • Managing Cash Flow • Controlling Credit • Pricing • Obtaining Capital • Profitability • Planning
Investment InterestLabors & Management SalaryRisk Profit Producers have returns to:
Income Statement Is Critical For Measuring • Profitability • Return on assets • Return on equity • Financial efficiency • Ratio of operating expenses to value of production • Ratio of debt service to value of production
Income Statement • Total Revenue • Value of plants sold $1,290,181 • Change in inventory 40,125 • Increase in supplies 897 • Misc. cash income 14,601 Total Revenue $1,345,803 Less Cost of Goods Sold $878,633 (Prefinished, cost of production) ______ Gross Margin $467,170 Less Operating Expenses $392,924 ______ NET REVENUE (before taxes) $74,246
Net Profit Margin Focus on Factors Affecting the Income Statement
Interpretation Net profit margin = profit per dollar of sales after paying the owner’s salary and accounting for opportunity cost of capital invested.
Common Problems With Profit Margin • Wrong pricing system • Prices have not been increased as costs have increased • Costs are too high relative to size of business • Not enough sales for the resources allocated • High overhead costs • Wasteful spending on inputs • Poor production
If Costs Are Too High: • Are we over-mechanized? • Is labor being used efficiently? • Do we have too much labor? • Do we have the right type of labor? • Is there too much labor in slack periods? • Is there a labor shortage in peak periods?
If Costs Are Too High: • What Costs Are The Highest? • Are These Controllable? • Are The Costs Necessary? • Can The Same Function Be Done A Better Way? • Would mechanization reduce costs?
Every Dollar Saved By Cost Control Equals A Dollar Of Profit!
Balance Sheet Or Net Worth Statement Is A Financial Snapshot Of Business On A Specific Date Shows: • Assets - Valuables The Business Owns • Liabilities - Claims Of Outsiders • Net Worth - Claims Of Owners
Balance Sheet Segregates, Assets and Debts Into: • Current • Non-Current