dBm Engineering 5446 Conestoga Ct. Boulder, CO 80301 dBmEngineering.com
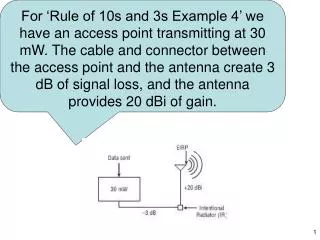
Sub – 1 Ohm Broadband Impedance Matching Network Design Methodology for High Power Amplifiers W. McCalpin dBm Engineering, Inc., Boulder, CO. dBm Engineering 5446 Conestoga Ct. Boulder, CO 80301 dBmEngineering.com. High Power Amplifier Design Challenges.


dBm Engineering 5446 Conestoga Ct. Boulder, CO 80301 dBmEngineering.com
E N D
Presentation Transcript
Sub – 1 Ohm Broadband Impedance Matching Network Design Methodology for High Power Amplifiers W. McCalpin dBm Engineering, Inc., Boulder, CO dBm Engineering 5446 Conestoga Ct. Boulder, CO 80301 dBmEngineering.com
High Power Amplifier Design Challenges A fixed-tuned broadband 50-Ohm test fixture is required with the following design constraints: • Prototype RF Power Transistor: Single-Ended 250W Pulsed LDMOS part • The design bandwidth required is 15% (1200 to 1400 MHz) as compared to ~ 3% for Wireless bands • High Power Pulsed Load Pull measurements have produced sub-1 Ohm target Load / Source impedances (ZLoad=0.8 – j1.0) to be held nearly constant over the bandwidth of interest
Outline • Motivation • Load Pull Impedance Accuracy • Proposed Simulation / Design Method • Matching Network Topology Selection • Simulation of “Ideal” Topology / Trajectory • Conversion of “Ideal” Circuit Simulation to a Physically-based Circuit Simulation • Fabrication of TRL Verification and DUT fixtures • Comparison of Measured vs. Simulated Trajectory and ZLoad • Summary
Motivation Q: Why is it difficult to go from High Power Load Pull measurements to working hardware? Q: Why do RF Power engineers still commonly rely heavily upon intuition, tuning and iteration? • Is Load Pull wrong? • The target impedances generated from doing Load Pull may not be accurate enough to truly represent what the DUT actually sees. • and / or • Is the simulation / design process wrong? • Common simulation techniques may not produce hardware that faithfully recreates the target impedances (when the designer fabricates the physical circuit from the simulated circuit).
ZMeas 50 Ω ZMeas ZCal Load Pull Tuner Impedance Accuracy (calibrated impedance vs. actual impedance during measurement) e.g. for a ZCal point, what is the Output Tuner’s Load reflection coefficient when ZMeas is normalized to the ZCal point
* 50 Ω ZMeas * * * * * * Load Pull Tuner Impedance Accuracy (cont.) Focus Microwaves - PMT Load Pull System The Tuner by itself: Tuner Tuning to the indicated points: Worst Case R.L.(dB) meas. = ~ - 51 dB Tuning repeatability: Worst Case R.L.(dB) meas. = ~ - 47 dB (Based on a TRL 7/16” Connectorized VNA calibration with Sii≤ -60 dB)
The impedance presented to the DUT: * 50 Ω ZMeas Load Pull Test Fixture Tuner * * * * Tuning to the indicated points: * Worst Case R.L.(dB) meas. = ~ - 31 dB * Tuning repeatability: Worst Case R.L.(dB) meas. = ~ - 31 dB ZLoad Impedance Accuracy at the DUT plane (Based on a TRL Impedance Transforming PCB VNA calibration with Sii≤ -41 dB)
Load Pull Tuner Impedance Accuracy (cont.) • Given the proper discipline in calibration and setup, the accuracy of the Load Pull targets is very good • Load Pull targets should be useful for design as well as device characterization
Proposed Simulation / Design Method • Ideal impedance matching network topology / trajectory simulation (using circuit models and lumped elements) • Identification of the circuit response to tuning variations • Conversion of distributed elements to EM based multi-port S-parameter blocks • Conversion of lumped element models to measured one-port and two-port S-parameter blocks • Simulation refinement and design centering
Proposed Simulation / Design Method (cont.) • Design and fabrication of a TRL verification fixture and the break-apart DUT impedance matching fixture • Assembly of each half of the DUT fixture with component by component verification of the impedance matching trajectory using the TRL verification fixture • Full DUT fixture assembly • Top-level tuning and design centering • Break-apart measurement of the final Load and Source impedances.
Ideal Topology / Trajectory Simulation Output Matching Network 50 Ohms Z0 = 4.48 Ohms
Conversion of Distributed Elements to EM based Simulation (using Momentum) Generates a 13 port .s13p file to import into ADS to combine with the measured .s1p files of the components
Conversion of Lumped element circuit models to measured s1p and s2p files • Measured using 50-Ohm TRL standards either wafer-probed (preferred) or connectorized (as shown) • Using the application substrate and component mounting configuration to include all substrate parasitic effects • Commercially available Model Libraries are ideal – parameterized to substrate material, full range of values by product type, accurate and wideband to include harmonic frequencies, etc.
ZLoad Design and Fabrication of a Break-Apart DUT Impedance Matching Fixture Fabricated to be Break-apart using the substrate selected for the application
Design and Fabrication of an Impedance Transforming TRL Verification Test Fixture Fabricated on the substrate to be used in the application with a line width equal to the lead width of the DUT (500 mils)
ZLoad Measurement of the DUT Break-apart fixture using the TRL Verification fixture After TRL calibration using the Verification fixture, multiple measurements can be made as each lumped component is added
Summary Invest in your Methodology! • High Power Load Pull is useful for design as well as characterization • Choose a topology that will hit the required impedance targets and achieve the desired matching network trajectory • Replace the ideal circuit elements with EM and measurement based elements as early as possible • Verify each simulated step by measuring at every step • Know the impacts of tuning locations and keep them small • Center and finalize the tuning and • measure the final impedances • Improve the process
References [1] D. Williams and D. Walker, “On-Wafer Measurement Accuracy”, ARFTG Short Course on Measurements and Metrology for RF Telecommunications, November 2000 [2] http://www.boulder.nist.gov/micro