Download
1 / 1
10 likes | 173 Vues
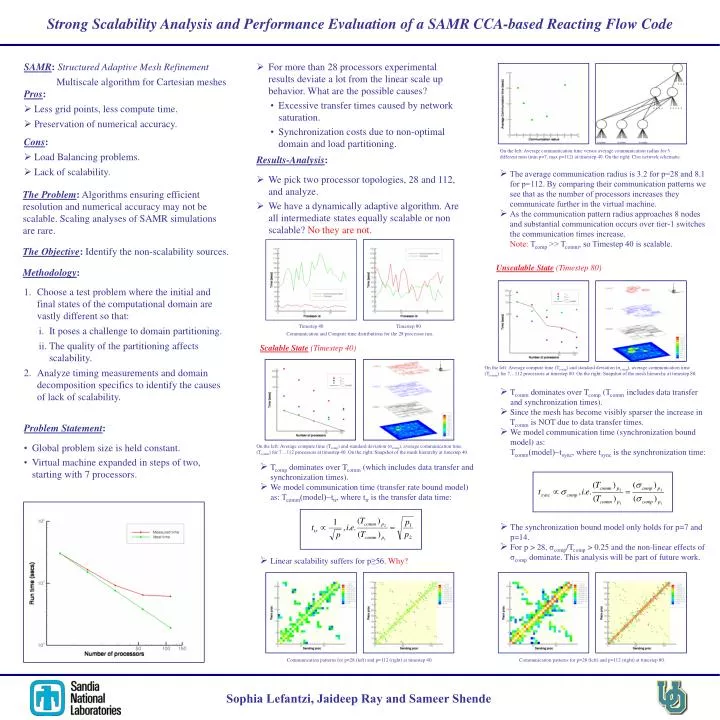
Strong Scalability Analysis and Performance Evaluation of a SAMR CCA-based Reacting Flow Code. SAMR : Structured Adaptive Mesh Refinement Multiscale algorithm for Cartesian meshes.

E N D
Strong Scalability Analysis and Performance Evaluation of a SAMR CCA-based Reacting Flow Code SAMR:Structured Adaptive Mesh Refinement Multiscale algorithm for Cartesian meshes • For more than 28 processors experimental results deviate a lot from the linear scale up behavior. What are the possible causes? • Excessive transfer times caused by network saturation. • Synchronization costs due to non-optimal domain and load partitioning. Pros: • Less grid points, less compute time. • Preservation of numerical accuracy. Cons: • Load Balancing problems. • Lack of scalability. On the left: Average communication time versus average communication radius for 5 different runs (min p=7, max p=112) at timestep 40. On the right: Clos network schematic. Results-Analysis: • The average communication radius is 3.2 for p=28 and 8.1 for p=112. By comparing their communication patterns we see that as the number of processors increases they communicate further in the virtual machine. • As the communication pattern radius approaches 8 nodes and substantial communication occurs over tier-1 switches the communication times increase. Note:Tcomp >> Tcomm, so Timestep 40 is scalable. • We pick two processor topologies, 28 and 112, and analyze. • We have a dynamically adaptive algorithm. Are all intermediate states equally scalable or non scalable? No they are not. The Problem: Algorithms ensuring efficient resolution and numerical accuracy may not be scalable. Scaling analyses of SAMR simulations are rare. The Objective: Identify the non-scalability sources. Methodology: Unscalable State (Timestep 80) • Choose a test problem where the initial and final states of the computational domain are vastly different so that: • It poses a challenge to domain partitioning. • The quality of the partitioning affects scalability. • Analyze timing measurements and domain decomposition specifics to identify the causes of lack of scalability. Timestep 40 Timestep 80 Communication and Compute time distributions for the 28 processor run. Scalable State (Timestep 40) On the left: Average compute time (Tcomp) and standard deviation (σcomp), average communication time (Tcomm) for 7…112 processors at timestep 80. On the right: Snapshot of the mesh hierarchy at timestep 80. • Tcomm dominates over Tcomp (Tcomm includes data transfer and synchronization times). • Since the mesh has become visibly sparser the increase in Tcomm is NOT due to data transfer times. • We model communication time (synchronization bound model) as: Tcomm(model)~tsync, where tsyncis the synchronization time: Problem Statement: • Global problem size is held constant. • Virtual machine expanded in steps of two, starting with 7 processors. On the left: Average compute time (Tcomp) and standard deviation (σcomp), average communication time (Tcomm) for 7…112 processors at timestep 40. On the right: Snapshot of the mesh hierarchy at timestep 40. • Tcomp dominates over Tcomm (which includes data transfer and synchronization times). • We model communication time (transfer rate bound model) as: Tcomm(model)~ttr, where ttris the transfer data time: • The synchronization bound model only holds for p=7 and p=14. • For p > 28, σcomp/Tcomp > 0.25 and the non-linear effects of σcomp dominate. This analysis will be part of future work. • Linear scalability suffers for p≥56. Why? Communication patterns for p=28 (left) and p=112 (right) at timestep 40. Communication patterns for p=28 (left) and p=112 (right) at timestep 80. Sophia Lefantzi, Jaideep Ray and Sameer Shende