Download
1 / 30
300 likes | 323 Vues
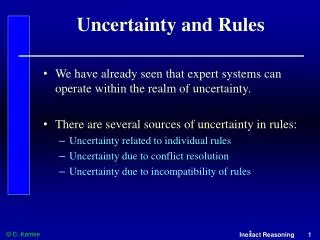
Combining Bayesian Beliefs and Willingness to Bet to Analyze Attitudes towards Uncertainty by Peter P. Wakker , Econ. Dept., Erasmus Univ. Rotterdam (joint with Mohammed Abdellaoui & Aurélien Baillon) RUD, Tel Aviv , June 24 '07. Topic: Uncertainty/Ambiguity. 2.

E N D
Combining Bayesian Beliefs and Willingness to Bet to Analyze Attitudes towards Uncertaintyby Peter P. Wakker, Econ. Dept.,Erasmus Univ. Rotterdam(joint with Mohammed Abdellaoui & Aurélien Baillon) RUD, Tel Aviv, June 24 '07 Topic: Uncertainty/Ambiguity.
2 Making uncertainty/ambiguity more operational:measuring, predicting,quantifying completely,in tractable manner. No (new) maths; but "new" (mix of) concepts: uniform sources; source-dependent probability transformation.
3 1. Introduction Good starting point for uncertainty: Risk. Many nonEU theories exist, virtually all amounting to: x y 0; xpy w(p)U(x) + (1–w(p))U(y); Relative to EU:one more graph …
w inverse-S, (likelihood insensitivity) extreme inverse-S ("fifty-fifty") expected utility motivational pessimism prevailing finding pessimistic "fifty-fifty" cognitive p Abdellaoui (2000); Bleichrodt & Pinto (2000); Gonzalez & Wu 1999; Tversky & Fox, 1997. 4
5 Now to Uncertainty (unknown probabilities); In general, on the x-axis we have events. So, no nice graphs …
We connect p. 9 (theory) next p. 6 Many tractable empirical studies;also inverse-S Many advanced theories;mostly ambiguity-averse CEU (Gilboa 1987; Schmeidler 1989) Curley & Yates 1985 PT (Tversky & Kahneman 1992) Fox & Tversky 1995 Multiple priors (Gilboa & Schmeidler 1989) Kilka & We-ber 2001 Cabantous 2005 Endogeneous definitions (Epstein, Zhang, Kopylov, Ghirardato, Marinacci) di Mauro & Maffioletti 2005 Einhorn & Hogarth 1985 Smooth (KMM; Nau) Variational model (Maccheroni, Marinacci, Rustichini) Biseparable (Ghirardato & Marinacci 2001) Nice graphs, but x-axis-problem: choice-less probability-inputs there Choice-based
7 Einhorn & Hogarth 1985 (+ 1986 + 1990). Over 400 citations after '88. For ambiguous event A, take "anchor probability" pA (c.f. Hansen & Sargent). Weight S(pA): S(pA) = (1 – )pA + (1 – pA); : index of inverse-S (regression to mean); ½. : index of elevation (pessimism/ambiguity aversion);
p. 6 (butter fly-theories) 8 Einhorn & Hogarth 1985 Graphs: go to pdf file of Hogarth & Einhorn (1990, Management Science 36, p. 785/786).Problem of the x-axis …
9 2. Theory Only binary acts with gains. All popular static nonEU theories (except variational): x y 0; xEy W(E)U(x) + (1–W(E))U(y).(Ghirardato & Marinacci 2001). For rich S, such as continuum, general W is too complex.
10 Machina & Schmeidler (1992), probabilistic sophistication: x y; xEy w(P(E))U(x) + (1–w(P(E)))U(y). Then still can get nice x-axis for uncertainty! However,
Known urnk Unknown urnu ? 20–? 20 R&B in unknown proportion 10 R 10 B < > + + 1 1 11 Ellsberg paradox. Two urns with 20 balls. Ball drawn randomly from each. Events: Rk: Ball from known urn is red. Bk, Ru, Bu are similar. Common preferences between gambles for $100: (Rk: $100) (Ru: $100) (Bk: $100) (Bu: $100) P(Rk) > P(Ru) P(Bk) > P(Bk) > Under probabilistic sophistication with a (non)expected utility model:
12 Ellsberg: There cannot exist probabilities in any sense. No "x-axis" and no nice graphs … (Or so it seems?)
13 Ellsberg paradox. Two urns with 20 balls. Known urnk Unknown urnu ? 20–? 20 R&B in unknown proportion 10 R 10 B Ball drawn randomly from each. Events: Rk: Ball from known urn is red. Bk, Ru, Bu are similar. Common preferences between gambles for $100: (Rk: $100) (Ru: $100) (Bk: $100) (Bu: $100) P(Rk) > P(Ru) P(Bk) > P(Bk) + + 1 1 > Under probabilistic sophistication with a (non)expected utility model: < > models, depending on source two reconsidered.
14 Step 1 of our approach(to operationalize uncertainty/ambiguity): Distinguish between different sources of uncertainty. Step 2 of our approach: Define sources within which probabilistic sophistication holds. We call them Uniform sources.
15 Step 3 of our approach: Develop a method for (theory-free)* eliciting probabilities within uniform sources; empirical elaboration of Chew & Sagi's exchangeability. * Important because we will use different decision theories for different sources
16 Step 4 of our approach: Decision theory for uniform sources S, source-dependent. E denotes event w.r.t. S. x y; xEy wS(P(E))U(x) + (1–wS(P(E)))U(y).wS: source-dependent probability transformation.(Einhorn & Hogarth 1985; Kilka & Weber 2001) Ellsberg: wu(0.5) < wk(0.5) u: k: unknown known (Choice-based) probabilities can be maintained. We get back our x-axis, and those nice graphs!
17 We have reconciled Ellsberg 2-color with Bayesian beliefs! (Also KMM/Nau did partly.) We cannot do so always; Ellsberg 3-color(2 sources!?).
` Figure 5.2. Quantitative indexes of pessimism and likelihood insensitivity w(p) d =0 d =0.11 1 1 d =0.11 d =0.14 0.89 c =0.11 c =0.08 c= 0 0 0 0 0.11= c p Fig.d. Insensitivity index a: 0.22; pessimism index b: 0.06. Fig.c. Insensitivity index a: 0.22; pessimism index b: 0. Fig.a. Insensitivity index a: 0;pessimism index b: 0. Fig.b. Insensitivity index a: 0; pessimism index b: 0.22. 18 Theory continued: (Chateauneuf, Eichberger, & Grant 2005 ; Kilka & Weber 2001; Tversky & Fox 1995)
19 3. Let the Rubber Meet the Road: An Experiment Data: 4 sources: • CAC40; • Paris temperature; • Foreign temperature; • Risk.
20 Figure 6.1. Decomposition of the universal event E = S b0 b1 E E a1/2 b0 b1 E E E E a1/4 a1/2 a3/4 b0 b1 E E a1/4 a3/8 a1/2 a3/4 a7/8 a1/8 a5/8 b0 b1 The italicized numbers and events in the bottom row were not elicited. E E E E E E Method for measuring choice-based probabilities
Figure 7.1. Probability distributions for CAC40 Figure 7.2. Probability distributions for Paris temperature 1.0 1.0 Real data over the year 2006 Real data over 19002006 0.8 0.8 Median choice-based probabilities (real incentives) Median choice-based probabilities (hypothetical choice) 0.6 0.6 Median choice-based probabilities (hypothetical choice) Median choice-based probabilities (real incentives) 0.4 0.4 0.2 0.2 0.0 0.0 30 25 35 2 1 0 1 20 3 2 3 15 10 21 Results for choice-based probabilities Uniformity confirmed 5 out of 6 cases.
Figure 7.3. Cumulative distribution of powers 1 Real Hypothetical 0.5 0 2 3 1 0 Method for measuring utility 22 Certainty-equivalents of 50-50 prospects. Fit power utility with w(0.5) as extra unknown. Results for utility
23 Results for uncertainty ("ambiguity?")
Figure 8.3. Probability transformations for participant 2 risk: a=0.42, b=0.13 1 0.875 0.75 Paris temperature; a=0.78, b=0.12 0.50 0.25 foreign temperature; a=0.75, b=0.55 0.125 Many economists, erroneously, take this symmetric weighting fuction as unambiguous or ambiguity-neutral. 0 0.25 0.75 1 0.125 0.50 0.875 0 Fig. a. Raw data and linear interpolation. 24 Within-person comparisons
Figure 8.4. Probability transformations for Paris temperature 1 0.875 0.75 participant 2; a=0.78, b=0.69 0.50 0.25 participant 48; a=0.21, b=0.25 0.125 * 0 0 0.25 0.50 0.75 0.875 1 0.125 * Fig. a. Raw data and linear interpolation. 25 Between-person comparisons
26 Example of predictions [Homebias; Within-Person Comparison; subject lives in Paris]. Consider investments. Foreign-option: favorable foreign temperature: $40000 unfavorable foreign temperature: $0 Paris-option: favorable Paris temperature: $40000 unfavorable Paris temperature: $0 Assume in both cases: favorable and unfavo-rable equally likely for subject 2; U(x) = x0.88. Under Bayesian EU we’d know all now. NonEU: need some more graphs; we have them!
Foreign temperature Paris temperature decision weight 0.49 0.20 expectation 20000 20000 certainty equivalent 17783 6424 uncertainty premium 2217 13576 risk premium 5879 5879 ambiguity premium –3662 7697 27 Within-person comparisons (to me big novelty of Ellsberg):
Subject 48, p = 0.875 Subject 2, p = 0.875 Subject 48, p = 0.125 Subject 2, p = 0.125 0.08 0.52 decision weight 0.35 0.67 expectation 5000 5000 35000 35000 25376 2268 19026 certainty equivalent 12133 uncertainty premium 2732 15974 9624 –7133 risk premium 5717 2078 –39 –4034 ambiguity premium –3099 10257 9663 654 28 Between-person comparisons; Paris temperature
29 Conclusion: By (1) recognizing importance of uniform sources and source-dependent probability transformations; (2) carrying out quantitative measurements of (a) probabilities (subjective), (b) utilities, (c) uncertainty attitudes (the graphs), all in empirically realistic and tractable manner, we make ambiguity completely operational at a quantitative level.
30 The end