Download
1 / 84
850 likes | 999 Vues
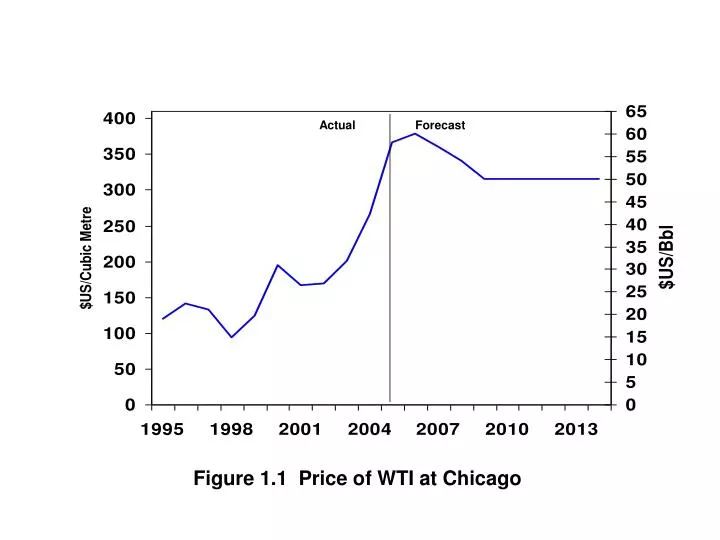
Actual. Forecast. Figure 1.1 Price of WTI at Chicago. Actual. Forecast. Figure 1.2 Average price of oil at Alberta wellhead. Actual. Forecast. Figure 1.3 Average price of natural gas at plant gate. Figure 1.4. Alberta gas well cost estimations

E N D
Actual Forecast Figure 1.1 Price of WTI at Chicago
Actual Forecast Figure 1.2 Average price of oil at Alberta wellhead
Actual Forecast Figure 1.3 Average price of natural gas at plant gate
Figure 1.4. Alberta gas well cost estimations Drilling, casing and completion costs estimates (in millions 2003$) By Modified PSAC Area Area 7 Area 6 0.42 0.45 0.27 0.29 5.5% 6.2% Area 2 Area 5 1.79 1.97 0.73 0.82 Area 4 0.42 0.45 12.3% 12.0% 5.5% Area 1 2.29 2.29 Area 3 0.18 0.18 0.0% 4.8% • Source: PSAC 2004 Well Cost study (2003 dollars) and PSAC 2002 Well Cost study (2001 dollars) 2002 2004 increase in costs (in percentage, over 2 years)
Figure 1.5. Alberta oil well cost estimations Drilling, casing and completion costs estimates. (in millions 2003$) By Modified PSAC Area Area 7 0.78 0.85 9.0% Area 5 Area 4 0.61 0.64 0.53 0.52 4.3% -2.1% Area 3 0.66 0.75 13.2% • Source: PSAC 2004 Well Cost study (2003 dollars) and PSAC 2002 Well Cost study (2001 dollars) 2002 2004 increase in costs (in percentage, over 2 years)
Actual Forecast Figure 1.7. Alberta GDP growth, unemployment & inflation rates
Figure 2.2. Comparison of Alberta’s crude oil and crude bitumen reserves
Figure 2.3. Bitumen pay isopachs for the Athabasca Wabiskaw-McMurray deposit at 6 mass per cent cutoff and greater than 1.5 metres
Figure 2.4. Net pay isopachs for recoverable bitumen within the Athabasca Wabiskaw-McMurray at 6 mass per cent cutoff and greater than 10 metres
ATHABASCA 111.7 PEACE RIVER 2.5 17.5 COLD LAKE 41.4 In Situ Mined Bitumen Figure 2.5. Production of bitumen in Alberta 2004 103 m3/d
Figure 2.7. Alberta crude bitumen production Actual Forecast 103 m3/d Surface Mining In Situ
Figure 2.8. Total in situ bitumen production and producing bitumen wells
Figure 2.9. Alberta synthetic crude oil production Actual Forecast 103 m3/d Synthetic Crude Oil
Figure 2.10. Alberta Demand and Disposition of Crude Bitumen and SCO Actual Forecast Nonupgraded Bitumen Removals from Alberta 103 m3/d SCO Removals from Alberta Alberta Demand (mainly SCO)
Figure 3.2. Annual changes in conventional crude oil reserves
Figure 3.6. Initial established crude oil reserves based on various recovery mechanisms (106 m3) Light-medium Heavy
Figure 3.7. Geological distribution of reserves of conventional crude oil
Fig. 3.8. Regional distribution of Alberta oil reserves (106 m3) 176 159 14 21 1193 478 49 384 75 45 17 2 258 45 2004 Initial established reserves 2664.9 106 m3 2004 Remaining established reserves 249.2 106 m3
Figure 3.9. Alberta’s remaining established oil Reserves versus cumulative production
Figure 3.10. Growth in initial established reservesof crude oil 3130 Ultimate potentiial 106 m3
149 178 Figure 3.11. Alberta successful oil well drilling By Modified PSAC Area 62 41 12 8 557 679 389 616 350 323 2 8 2003 Wells Drilled = 2345 534 386 2004 Wells Drilled = 1949
Figure 3.12. Oil wells placed on production, 2004 By Modified PSAC Area Figure 3.13. Initial operating day rates of oil wells placed on production, 2004 By Modified PSAC Area 44 17.9 (112) 150 12.7 (80) 410 368 7.3 (46) 609 7.3 (46) 4.8 (30) 3 5.5 (34) 326 10.5 (66) Total = 1910 wells m3/day/well (bbl/day/well)
Figure 3.15. Total crude oil production and producing oil wells
Figure 3.17. Total conventional crude oil Production by year placed on production Percent of total production from oil wells 6% 11% 7% 6% 7% 3% 3% 6% 4% 4% 42%
Figure 3.18. Comparison of crude oil production Texas Onshore Alberta Crude Oil Louisiana Onshore
Figure 3.19. Alberta Crude Oil Price and Well Activity Actual Forecast
Figure 3.20. Alberta daily production of crude oil Actual Forecast Production (103 m3/d) Heavy Crude Oil Light-Medium Crude Oil
Figure 3.21. Capacity and location of Alberta refineries Refinery Capacities - m3/d
Figure 3.22. Alberta demand and disposition of crude oil Actual Forecast 103 m3/d Crude Oil Removals from Alberta Alberta Demand
Figure 3.23. Alberta supply of crude oil and equivalent Actual Forecast Nonupgraded Bitumen 103 m3/d SCO Pentanes Plus Heavy Light-Medium
Figure 4.1.Alberta successful gas well drilling – coalbed methane By Modified PSAC Area 613 151 3 407 2004 Wells Drilled = 1174
Figure 5.1. Annual reserves additions and production of marketable gas
Figure 5.3. Alberta unconnected gas reserves, 2004 By Modified PSAC Area 3 4 22 4 15 6 2 16 Total = 72 109m3 * Numbers not to scale
Figure 5.4. New, development, and revisions to marketable gas reserves
Figure 5.5. Marketable Gas Reserves Changes, 2004 By Modified PSAC Area 109m3 0.0 4.9 71.0 3.7 17.9 12.0 -3.7 40.1 Total = 145.9 109m3 * Numbers not to scale
Figure 5.8. Geological distribution of marketable gas reserves